
What Is the Bitcoin Stock-to-Flow Model (S2F)?
The Bitcoin Stock-to-Flow Model (S2F) is a theoretical model that estimates and explains the asset price of Bitcoin based on its scarce supply. Traditionally, the S2F model has been used to value precious metals such as gold and silver. A Medium article written by PlanB in 2019 popularized the use of the S2F model for Bitcoin.
Key Takeaways
-
Purpose: A model traditionally used for gold and silver, the S2F model was famously adapted for Bitcoin by the analyst “PlanB” to link its price to its scarcity.
-
Popularity: For several years, particularly during the 2020-2021 bull market, Bitcoin’s price tracked the model’s predictions with remarkable accuracy.
-
Failure: The model’s predictions began to fail in late 2021, and the price has deviated significantly from the model’s path ever since.
-
Flaws: The model is heavily criticized for ignoring all demand-side factors and for having several statistical flaws that critics argue invalidate its reliability.

What Is the Stock-to-Flow Ratio?
At its core, the Stock-to-Flow ratio is a simple yet powerful way to quantify the rarity of a resource. It has been used in traditional markets to evaluate commodities, especially precious metals.
The ratio is based on a straightforward formula:
The stock is the total amount of total existing supply of an asset, in terms of Bitcoin, this is Bitcoin’s total circulating supply. The flow is the amount of new supply, or new Bitcoin that is created or produced each year.
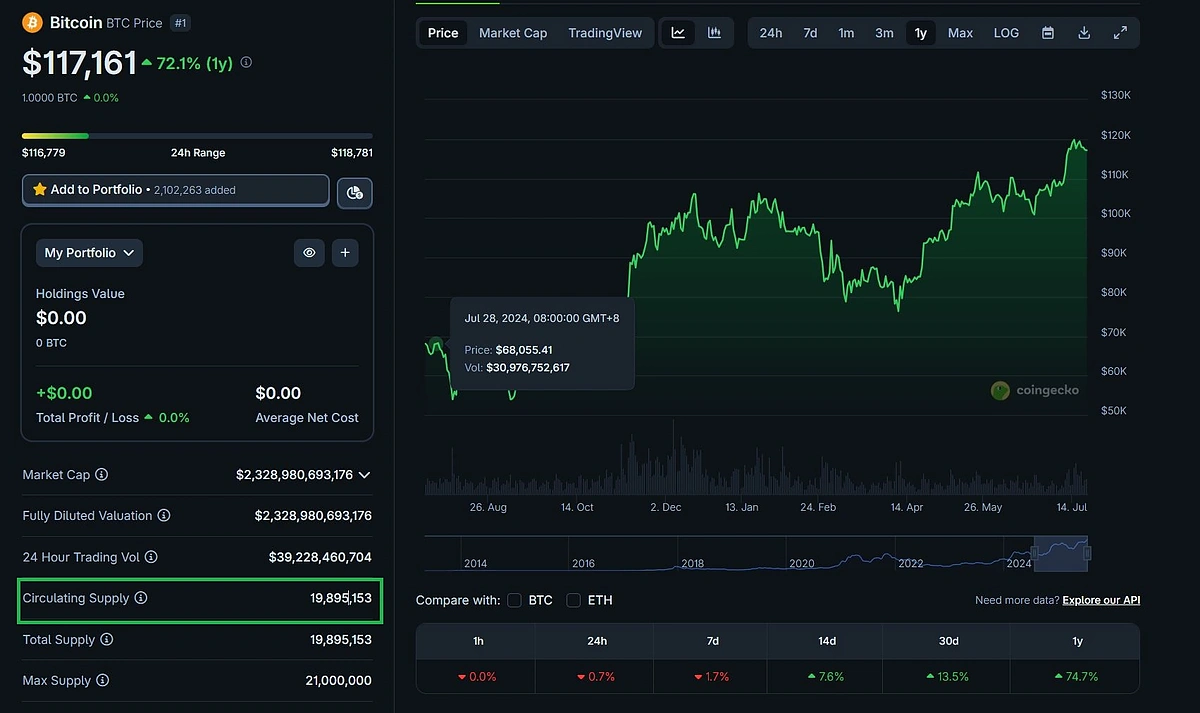
You may find Bitcoin’s circulating supply at https://www.coingecko.com/en/coins/bitcoin.
The resulting S2F ratio tells you how many years it would take, at the current rate of production, to create the entire existing stock. A higher S2F ratio indicates that an asset is harder to produce relative to its existing supply, making it scarcer and, theoretically, a better store of value.
An analogy helps to clarify this. Imagine a world-famous painter who has created 1,000 paintings over their lifetime. This collection of 1,000 paintings is the stock. Now, imagine the painter is old and only produces 10 new paintings each year. This is the flow. The S2F ratio would be 1000/10=100. It would take 100 years to replicate his existing collection. This high ratio makes the paintings rare and valuable.
How It’s Used in Gold and Silver
The S2F model is most relevant for monetary goods (assets that are held primarily as a store of value rather than for industrial consumption). Gold and silver are classic examples.
Gold has been used as money for thousands of years for many reasons but mainly because of its durability and scarcity. When we quantify this scarcity through the S2F ratio, we can estimate just how rare and by extension how valuable gold is.

According to PlanB, gold’s S2F ratio is approximately 62, far higher than that of silver which is at 22. This high ratio means that even a decade’s worth of gold production will not significantly change the supply of the existing stockpile of gold.
The table below provides a comparison of various assets illustrating how Bitcoin’s programmed scarcity has eventually surpassed that of Gold.
|
Asset |
Approx. Stock |
Approx. Annual Flow |
Calculated S2F Ratio |
|
Gold |
185,500 tonnes |
3,000 tonnes |
~62 |
|
Silver |
550,000 tonnes |
25,000 tonnes |
~22 |
|
Bitcoin (Pre-2020 Halving) |
18,000,000 BTC |
657,000 BTC |
~27 |
|
Bitcoin (Post-2024 Halving) |
19,687,500 BTC |
164,250 BTC |
~119 |
How “Flow” is Different in Bitcoin
Bitcoin’s programmed decrease of “flow” every four years through the Bitcoin Halving (where a miner’s reward is halved) is the key method for it to eventually surpass gold in terms of the S2F ratio.
To understand this difference, we first need to understand supply inelasticity. This simply asks, “How easily can more of something be made when its price goes up?” Both gold and Bitcoin have an inelastic supply, but to very different degrees.
Gold’s supply is highly inelastic. If its price were to double, mining becomes more profitable, incentivizing more production. But this process is incredibly slow and difficult. The supply reacts to price, but not easily.
Bitcoin’s supply, however, is perfectly inelastic. Its “flow” is programmed entirely by code, not by price. If Bitcoin’s price skyrockets, more Bitcoin miners would certainly enter the market but the difficulty adjustment (a feature that changes how hard it is to find a block to keep the average block time at around 10 minutes) ensures that new Bitcoins are still produced on the same predictable schedule even when more miners enter the market. In other words, Bitcoin’s “flow” will not change because of Bitcoin price changes.
This fundamental difference in how new supply is created separates Bitcoin from every physical commodity, including gold. Gold’s production, while difficult, will always be influenced by market prices and human incentive. Bitcoin’s production, however, is dictated purely by its transparent code and the Bitcoin Halving. This establishes a new form of absolute, verifiable scarcity, one that is mathematically enforced rather than just physically limited.
Who Is “PlanB”?
The application of the Stock-to-Flow model to Bitcoin was popularized by a pseudonymous analyst known as “PlanB,” who claimed to be a Dutch institutional investor with a background in quantitative finance. In a now-famous Medium article published in March 2019 titled “Modeling Bitcoin’s Value with Scarcity,” PlanB laid out a compelling thesis that captivated the crypto world.
The S2F Thesis for Bitcoin
PlanB’s core hypothesis was that scarcity, as measured by the S2F ratio, is the primary driver of Bitcoin’s market value. He gathered monthly data for Bitcoin’s S2F ratio and its market capitalization and plotted them on a chart.
He then performed a linear regression analysis on the data, which yielded a 95% R-square value. In statistics, R-square measures how well a model’s predictions fit the actual data, with 100% being a perfect fit. In his view, this suggested that S2F alone could explain 95% of Bitcoin’s historical price movements. PlanB presented this as a statistically significant result, arguing that the tight fit of the model was highly unlikely to be due to chance.
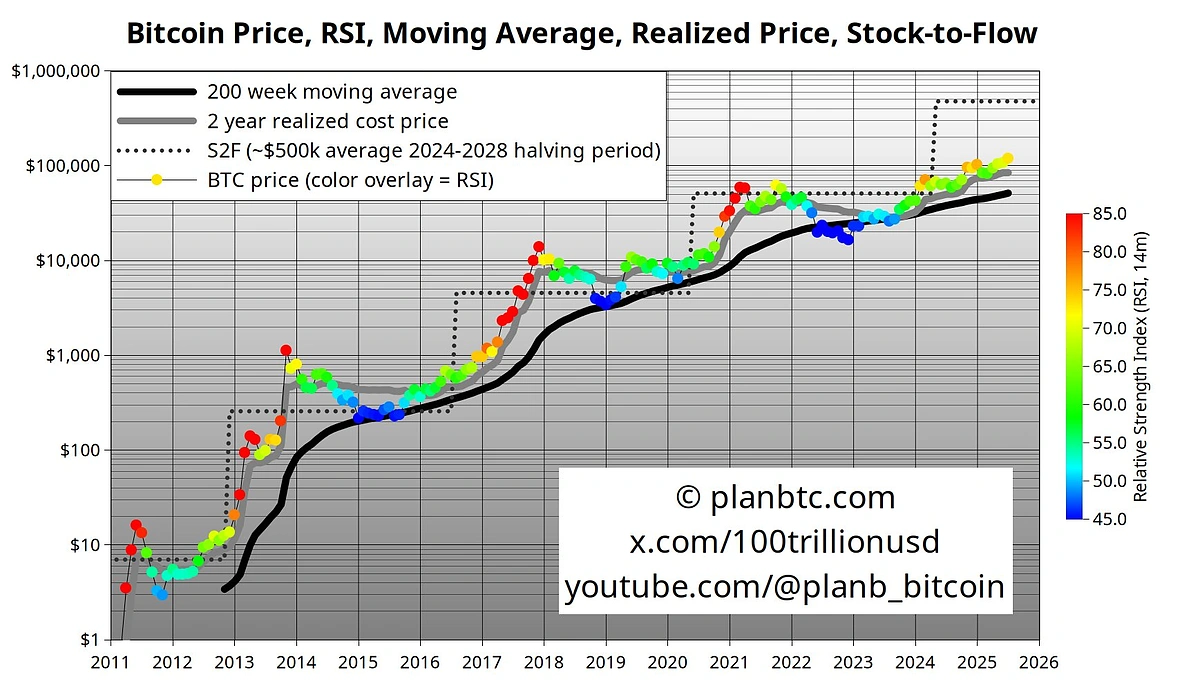
Source: https://x.com/100trillionUSD/status/1943932103898382698/photo/1
Interpreting the S2F Bitcoin Chart
Bottom Axis (X-axis): This is time, showing the years from 2011 to 2026.
Side Axis (Y-axis): This is the price of one Bitcoin
The Wavy Colored Line: This is the actual historical price of Bitcoin.
The dotted line: This is the Stock-to-Flow (S2F) model’s estimate of Bitcoin’s “fair value” based on how scarce it is. Each increased “step” is explained by the Bitcoin halving.
The Colors (Relative Strength Index): This acts like a heat map for the market, with red indicating that the market is hot or “overbought” and blue indicating cold or “oversold”.
Together, the chart was historically a good guide to predict and explain Bitcoin’s long-term cycles, suggesting that periods of a blue/cold market below the S2F line have historically been good accumulation zones, while periods of a red/hot market far above the S2F line have been times for caution.
Author’s Note
In this case, the S2F model and Bitcoin’s price appear to be highly correlated with each other because of the high R-square. But as the saying goes, “correlation is not causation”.
This is often because of a statistical illusion called a spurious correlation, where a hidden third factor makes two unrelated things appear connected. The classic example is ice cream sales and drowning deaths. Both spike in the summer, showing a high correlation, but ice cream does not cause drowning. The hidden factor is hot weather, which causes people to both eat more ice cream and swim more.
This is a common critique of PlanB’s S2F model but it doesn’t mean that his model is wrong, it simply means Bitcoin’s price increase is highly correlated with the S2F ratio, but it is not necessarily caused by it.
The History of the S2F Model
For a time, the Stock-to-Flow model seemed less like a theory and more like a law of physics. Its predictive power appeared undeniable, but its eventual downfall was just as dramatic as its rise.
The Glory Days When the Model Worked: 2015 to 2021
From roughly 2015 through late 2021, Bitcoin’s price (colored line) followed the S2F model’s trajectory (the dotted line) with uncanny accuracy. During the bull market of 2020 and 2021, as Bitcoin surged from under $10,000 to an all-time high of nearly $69,000, its price line on the chart hugged the S2F prediction line. This period of accuracy turned the model into a viral phenomenon. It was shared relentlessly on social media, discussed on podcasts, and cited by investors as a core reason for their bullish outlook.
When the Model Broke: 2022 to Present
The model’s credibility began to unravel in late 2021. PlanB’s “worst-case scenario” prediction of $98,000 by the end of November 2021 failed to materialize, with the price closing the month around $57,000. This was the first major crack in the model’s armor.
The real collapse came in 2022. The S2F model predicted that Bitcoin’s price should be well over $100,000 during this period. Instead, a brutal bear market took hold, driven by macroeconomic headwinds, collapses of major crypto firms, and waning retail interest. Bitcoin’s price crashed, eventually bottoming out below $16,000. The gap between the model’s predicted price and the actual price became increasingly apparent. This massive and sustained deviation led analysts, investors, and even former proponents to declare the model “broken” and invalidated.
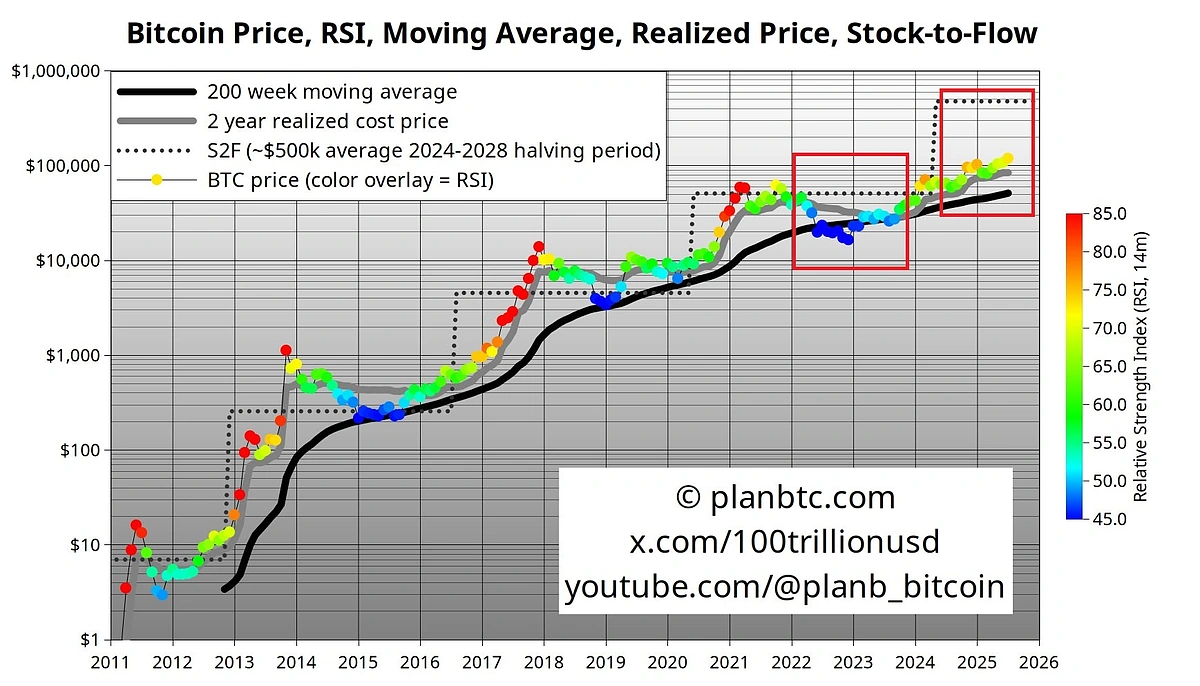
The periods of severe model deviation are highlighted in the red boxed area. This deviation suggests that at the time of writing in mid 2025, the model is either severely out of touch, or that we are in for a massive bull run.
Repurposing the Model: The S2F Deflection
After the S2F model failed as a direct price predictor, some traders found a new use for it. They began to focus on the deviation between the actual price and the S2F line, calling it the Stock-to-Flow Deflection.
The logic behind this new interpretation is simple: when the price line on the chart is far below the S2F model line, Bitcoin can be considered “undervalued” or in an “oversold” territory, potentially signaling a good buying opportunity. Conversely, when the price is significantly above the S2F line, it can be seen as “overvalued” or “overbought,” suggesting it might be time to sell. This approach repurposed the model from a predictive crystal ball into a market sentiment or cycle-timing indicator, acknowledging its flaws while still trying to extract some value from its core concept of scarcity-based valuation.
The Flaws of the S2F Model
The S2F model’s failure was not a surprise to many economists and statisticians, who had been pointing out its fundamental flaws for years. The criticisms range from the simple and intuitive to the highly technical.
Where Is the Demand?
The most significant and easily understood criticism of the S2F model is that it is entirely one-sided. In any market, price is determined by the laws of supply and demand. A model that only analyzes the supply schedule, no matter how predictable that supply is, is fundamentally incomplete. Vitalik Buterin, the co-founder of Ethereum famously called out the S2F model in an X post where he said that these models give people a “false sense of security”.
Stock-to-flow is really not looking good now.
I know it’s impolite to gloat and all that, but I think financial models that give people a false sense of certainty and predestination that number-will-go-up are harmful and deserve all the mockery they get. https://t.co/hOzHjVb1oq pic.twitter.com/glMKQDfSbU
— vitalik.eth (@VitalikButerin) June 21, 2022
Overall, by assuming that a predictable reduction in new supply would automatically lead to a higher price, the model made serious assumptions that demand would either remain constant or grow predictably. Any deviation from this sustained or increased demand, would render the entire model to fall apart.
Statistical Red Flags
Beyond the economic critique of ignoring demand, a more technical class of criticism targets the model’s internal mathematical and statistical structure.
To be clear, these are not opinions on Bitcoin’s value, but rather expert arguments from statisticians and econometricians about the validity of the model’s construction itself. They focus on whether the relationship PlanB identified is statistically sound or simply an illusion created by a flawed methodology. Notable critics include Marcel Burger and Sebastian Kripfganz. In particular, Dr Kripfganz found that “The models are not statistically significantly different from zero” meaning that the S2F model should not be taken too seriously.
-
Spurious Correlation: As mentioned earlier, a core argument is that the S2F model may be a classic case of spurious correlation. This occurs when two variables appear to be related, but the relationship is coincidental or caused by a third, unobserved factor.
-
Circular Reasoning: Another major criticism is that the model uses circular reasoning. The S2F model tries to indirectly predict price by using Bitcoin’s total market value as its dependent variable, which is calculated as (Price x Stock), the model then attempts to predict the total market value of Bitcoin using stock, which exists on both sides of the equation, meaning that the S2F model is using stock to predict itself. This wouldn’t be a problem if the dependent variable was price instead, but it is suspected that PlanB’s model would fall apart if he used price as the dependent variable.
-
Cointegration Failure: Cointegration is a statistical test to see if the relationship between the S2F ratio and Bitcoin’s price was a real, long-term connection or just a coincidence. By accounts of various Econometricians, the Bitcoin S2F model has failed these statistical tests, thereby invalidating the model.
Author’s Note
In my research for this topic, I have also found several other sources of academic criticism of the S2F model but many of which have been deleted and or taken down. One example is Nick Flow also known as BTconometrics, he once had sponsorships/referral relationships with Kraken and Swan Bitcoin, which suggests that he is a credible source. With many of these seemingly credible sources being taken down, there is a possibility that there may be a pattern of suppression with regards to critical analysis of the S2F model.
Other Factors Affecting Bitcoin’s Price Surge in 2025
Bitcoin has reached all-time-high prices of over $120,000 in 2025 and has managed to do so due to many factors, not solely just because of supply side changes from the Bitcoin Halving. Many of these factors are explained by the demand side of the price equation, which is ignored in the S2F model.
-
Favorable Macroeconomic Conditions: The lowering of interest rates has led to more investors being encouraged to buy riskier assets, to the benefit of Bitcoin.
-
Increased Inflation: Increased use of quantitative easing (printing of money), has led to widespread inflation which devalues fiat currency, leading to investors going to Bitcoin.
-
Increased Regulatory Support: The passing of crypto friendly law bills such as the GENIUS Act has definitely contributed to more institutions adopting Bitcoin.
-
Institutional Investor Support: The launch of Bitcoin spot ETFs, corporate treasury allocations mean that more smart money is buying up Bitcoin.
The above is a non-exhaustive list of examples of how there are other factors which are not included in PlanB’s model that explains why Bitcoin’s price has risen over the years. The accumulation of these factors perhaps explain why the S2F model became inaccurate over the years.
S2F’s Legacy in 2025 and Beyond
The journey of the Bitcoin Stock-to-Flow model is a fascinating case study in the search to explain Bitcoin’s meteoric rise in price. It rose from an obscure commodity metric to become a celebrated “crystal ball” that seemed to promise a predictable path to wealth. By 2025, the model has largely become defunct.
Despite its ultimate failure as a price predictor, the S2F model’s lasting legacy is arguably a positive one. Its greatest contribution was providing a simple, powerful, and intuitive framework that helped millions of people grasp Bitcoin’s best qualities of being a verifiable and scarce digital asset. It successfully packaged the complex “digital gold” narrative into an easy-to-understand chart.
This article is for educational purposes only and is not financial advice. The cryptocurrency market is highly volatile, and you should not make any investment decisions without conducting your own thorough research. The models and theories discussed are historical and may not be predictive of future performance.