Table of Contents
Bull or bear, when it comes to trading crypto, there’s a lot of money to be made, whichever way the crypto market swings. But what if you want to reach degen-level trading mastery? Then it’s mission-critical that you’ve got the right crypto tools in your arsenal to support your investment strategy.
So what’s in your crypto toolkit?
Let’s review our comprehensive list of cryptocurrency tools together to see what absolute must-haves you’re missing out on. That way, we can get you upskilled as a cryptocurrency trader verging on degen mastery in no time at all.
Ready, young grasshopper?
DefiLlama
 © DefiLlama
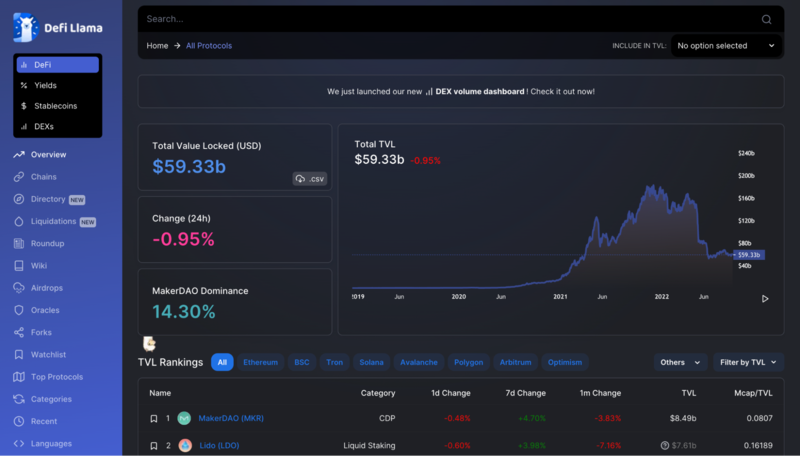
DefiLlama is a multi-chain dashboard that tracks the most popular protocols by total value locked (TVL). TVL is one of the most critical metrics for assessing the popularity of a protocol. The metric shows us how much liquidity is actually locked into a protocol.
Where does DefiLlama get all this data?
It pulls data from more than 80 Layer 1 blockchains, but not all the data is on-chain. In fact, the company aggregates its data by relying on behemoth data aggregators like CoinGecko. CoinGecko actively tracks more than 500 exchanges and 13,000 digital assets, making it one of the largest crypto data aggregators in the space.
DefiLlama provides highly intuitive dashboards, which make browsing TVL by protocol, airdrops, oracles, and more a breeze. DefiLlama also offers powerful filters that you can use to explore the platform and test what valuable insights you can extrapolate.
But remember that practice is crucial. And with a powerful tool like DefiLlama at your fingertips, you can easily teach yourself to identify potential trends.
 © DefiLlama
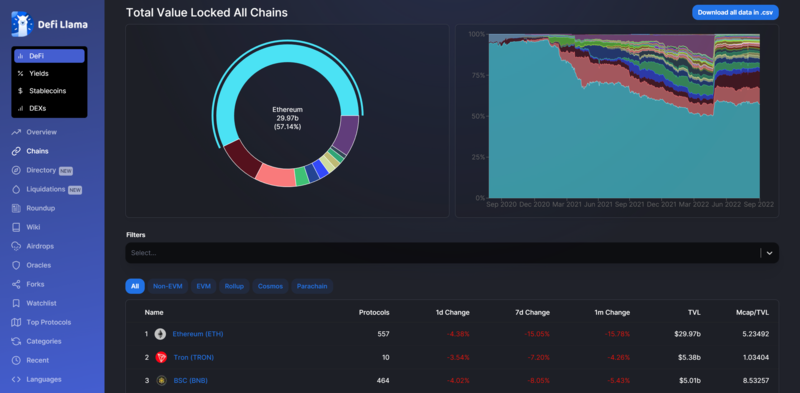
Let’s look at one of DefiLlama’s powerful features. Simply clicking on “Chains” on the left-hand sidebar pulls up a pie chart and a StackArea graph displaying a TVL breakdown by chains, the latter also including a date to help you track trends. Below, the tool provides a helpful breakdown of the relevant metrics.
And that’s just with one tab. How cool is that?
Dune
 © Dune
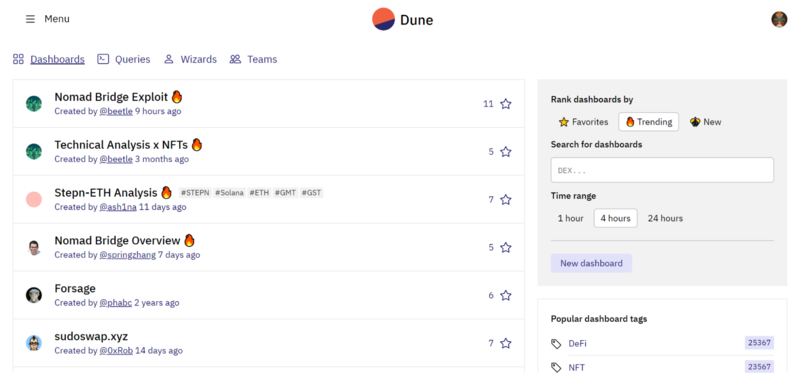
Dune (formerly known simply as Dune Analytics) is a community-driven data powerhouse. Dune allows any user to query the blockchain using SQL. And the most popular dashboards are available for your perusal, gratis. You can search for specific cryptocurrency projects, or you can browse trending projects. You can also browse your favorite creators’ dashboards.
As with most tools, a tool is only as powerful as its user. Holding a paintbrush doesn’t make me a Van Gogh. That’s why, as we mentioned earlier, it’s imperative that you put in time for practice, so that clearer actionable paths can be revealed to you, irrespective of which tools you ultimately choose to go with.
With Dune, you can drill down and get granular with the data as well. If you don’t know SQL, no worries! Just put in a request for data wizards to produce the dashboard of your dreams (at a cost, of course).
Here’s how you can get started with Dune. The best place to kick off is to explore dashboards that the most popular data scientists in the community have created. Since Dune uses a star system to sort dashboards by popularity, finding the most popular dashboards couldn’t be any easier.
You can also sort dashboards by trending and new or use the search field to search for your favorite projects. (Want to read more about Dune? Then make sure to check out our comprehensive guide.)
CoinGecko
 © CoinGecko
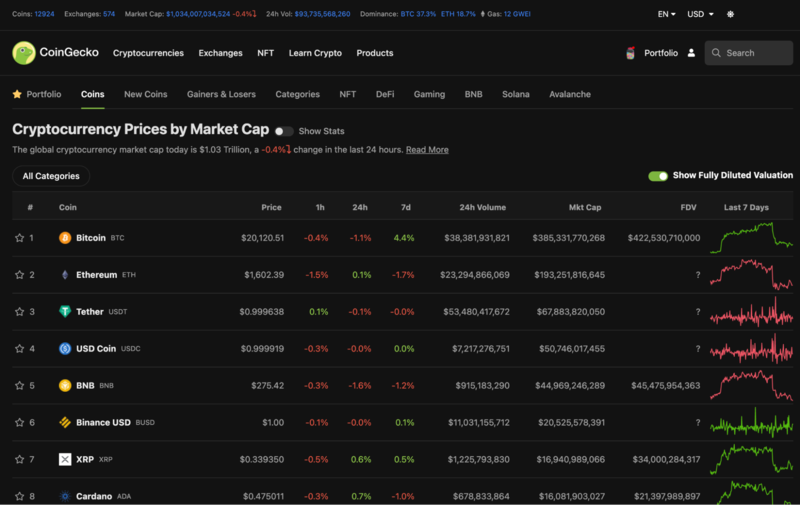
CoinGecko isn’t just a cryptocurrency data aggregator platform. To call it that would be incredibly myopic. Sure, even considering only the listings, CoinGecko is impressive, aggregating data from tens of thousands of digital assets.
With CoinGecko, you can drill down for every crypto asset, simply by clicking on it. Digging deeper reveals the contract address, which comes in handy when you’re using MetaMask to import custom tokens.
But we’re just scratching the surface here.
 © CoinGecko
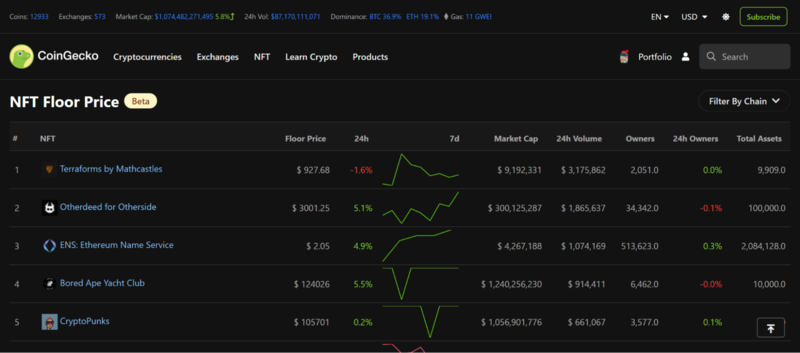
In addition to providing some of the most comprehensive educational blockchain content in the crypto space, CoinGecko offers tools like NFT Floor Price, where you can track the floor price of NFT projects on both Ethereum and Avalanche, with more chains to come later.
Or how about the Compare Coins Feature, where you can compare the price of a digital currency based on the market capitalization and fully diluted valuation (FDV) of another? This simple tool is indispensable when considering where to get the most bang for your buck.
Want to become an expert on using CoinGecko? Read our guide on how to CoinGecko.
Nansen
 © Nansen
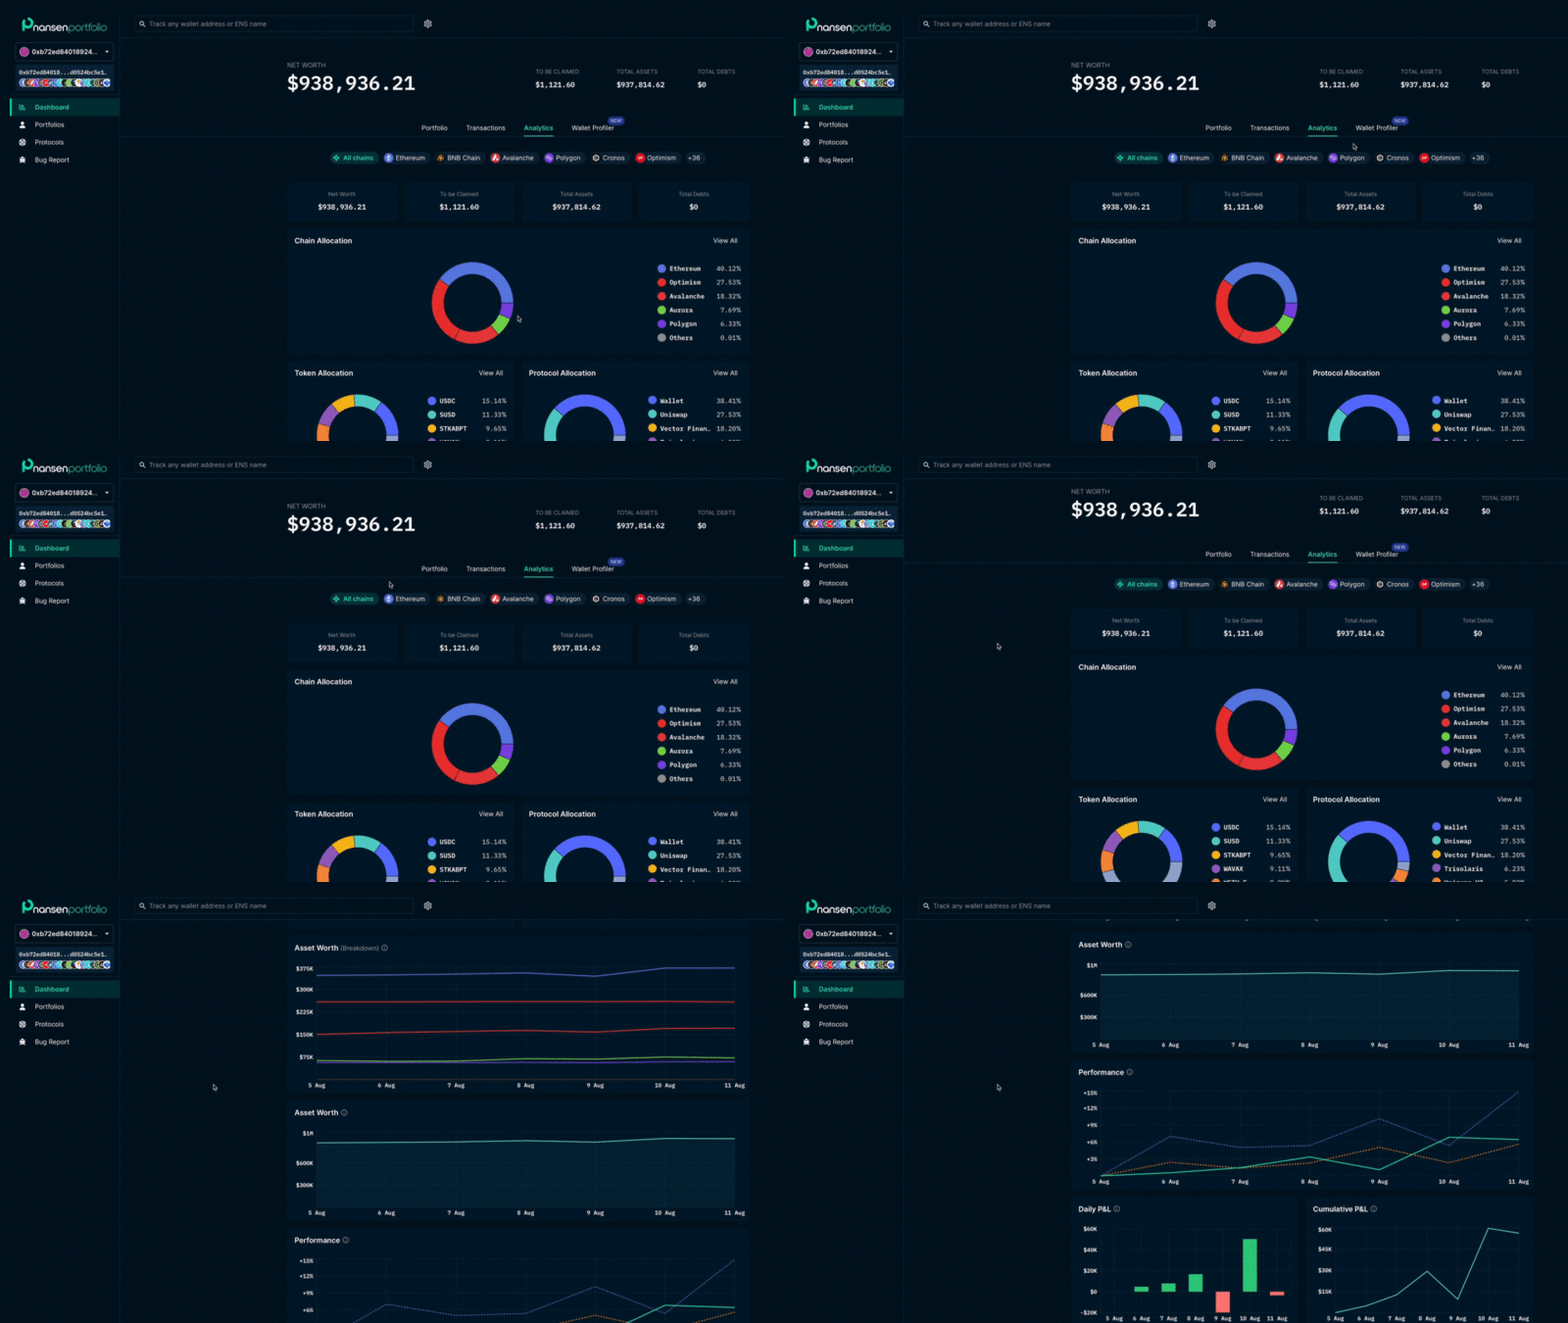
Nansen has quickly solidified its reputation as one of the most reliable blockchain data analytics platforms. Unlike its decentralized, community-driven counterpart Dune, Nansen boasts an internal team of experts who have built a suite of advanced trading tools you’ll be hard-pressed to find elsewhere.
For instance, Nansen tracks 70 million+ wallets. This makes it easy to follow money flows, and to extrapolate insights and patterns that would not jump out at you so readily with fewer data points.
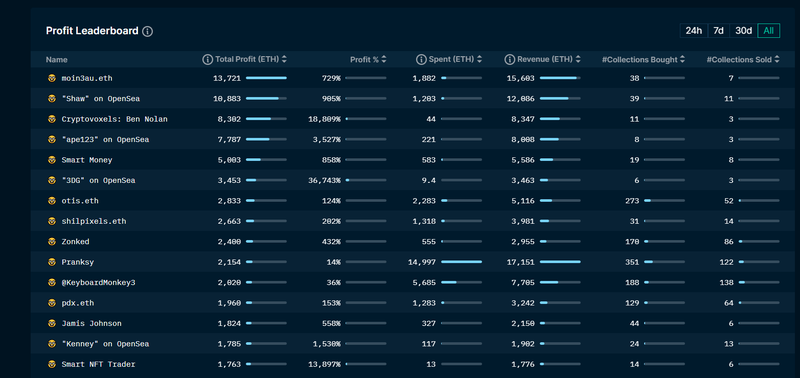
Let’s say you want to track the wallets of NFT whales, since doing so will give you a massive informational advantage over those who are going in blind. NFT Paradise is a Nansen dashboard that provides live floor price updates from OpenSea. From here, you can use the Profit Leaderboard to look at the most profitable wallets in the NFT space.
 © Nansen
Nansen even lets you set up custom alerts (yes, even for activity tied to a specific wallet), and all of this in just a few clicks!
You can also track gas usage, and see what non-NFT whales are up to in the Ethereum ecosystem too. Sure, Nansen’s paid plan does cost a pretty penny, but there’s also a free version. It’s called Nansen Lite, and you can check it out here.
Glassnode
 © Glassnode
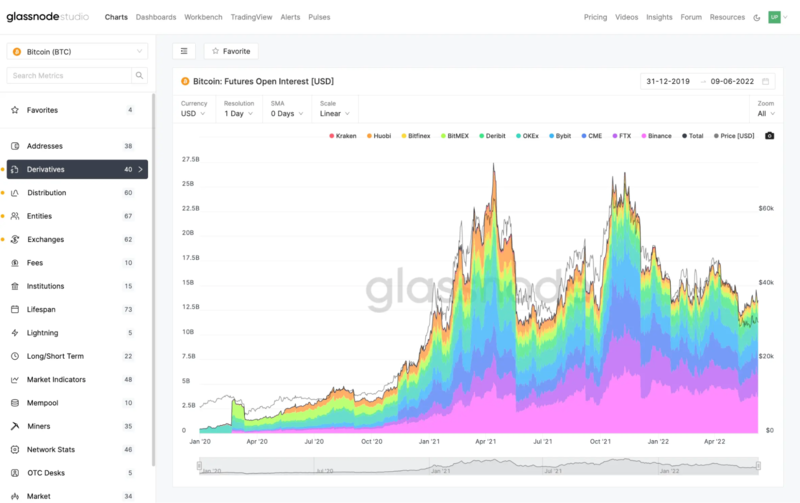
Glassnode is yet another on-chain analytics platform, one that’s centralized like Nansen. But the value of Nansen is focused more on its ability to track crypto wallets and money flows. In contrast, Glassnode provides a more holistic overview of blockchain data.
Glassnode Academy is also a major differentiator. The academy is a useful repository of helpful explanations on critical metrics. Moreover, this knowledge hub covers how to use Glassnode’s tools and read the charts provided. In essence, it’s a way to make Glassnode stickier to its more educated users.
With Glassnode Studio, users can access all sorts of data, from the more basic crypto exchange data to profit & loss ratios and miner data.
Finally, Glassnode Insights provides frequent reports and analyses from Glassnode’s internal team. These reports are available not just in English, but in Italian, Spanish, Chinese, and Japanese as well.
RugDoc
 © RugDoc
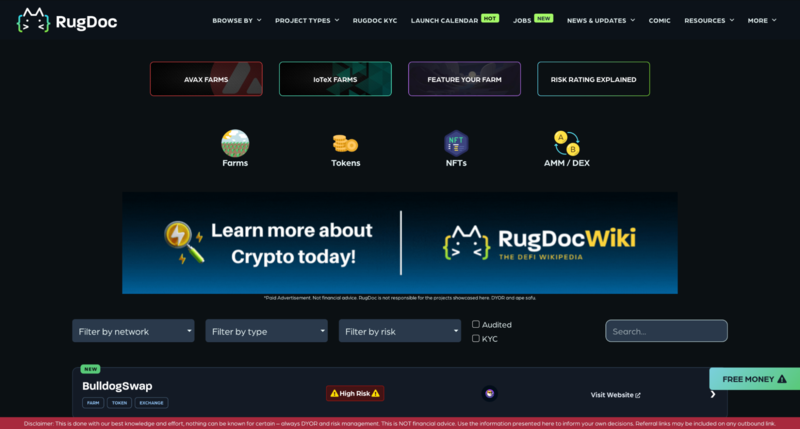
RugDoc audits code to ensure the safety of blockchain protocols. They also provide a comprehensive wiki to promote blockchain education (*Chef’s kiss*). In fact, they want to be the best community-driven wiki for crypto users who wish to know how to protect themselves.
So how do you receive an audit for a protocol you’re interested in? All you’ve got to do is join the official RugDoc Telegram or Discord channel, and fill out a review request form. Within 36 hours, the review will be published on the RugDoc website. How’s that for a dedicated team living up to the ethos of web3? (Here’s a helpful guide on how to read RugDoc’s reviews on checked protocols.)
A tool like this is indispensable for assessing risk, since crypto users who are unable to read smart contracts are at the whims of others. With RugDoc, users can rely on the pros… at no cost.
Alphaday
 © Alphaday
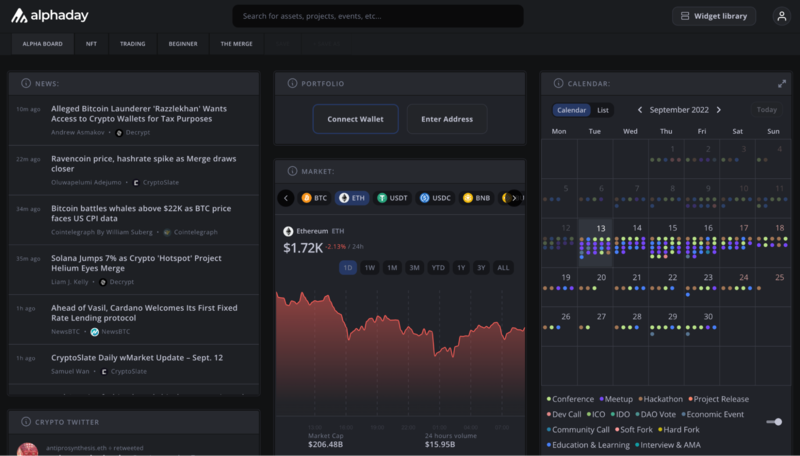
Alphaday is a gorgeous platform designed to gather all the crypto data into a single comprehensive dashboard. It’s separated into four main components, by tabs in the upper-left-hand corner:
1. Alpha Board: The first tab showcases a dashboard granting an overview of all the important ongoings in crypto. On the left, you have the News tab, and below that, a Crypto Twitter feed. In the center, you can connect your crypto wallet to view your portfolio. You also have an overview of protocols by TVL. On the right is a calendar marking important dates.
What’s crucial to note is that these widgets aren’t fixed, but customizable. Just click on the “Widget Library” button in the top-right-hand corner. Doing so produces a sidebar, where you can handpick the widgets you wish to include in your dashboard.
2. NFTs: One click on the NFT tab, and you’ll be greeted with a similar-looking dashboard, but in this case, it’s NFT-specific. For instance, the center of the page lists trending NFTs for you to track floor prices and so on. Moreover, the calendar to the right now tracks important dates in the NFT community. These include DAO votes and initial decentralized exchange (DEX) offerings (IDOs).
3. Trading: The trading dashboard shows you charts, technical indicators, market sentiment analysis, and more.
4. Beginner: The beginner dashboard isn’t all that different from the rest, except it’s catered to—you guessed it—beginners. There’s a lot of info here for learning, and it’s easy to get overwhelmed with all these widgets and info. So if you’re just starting out, keep things simple. Less is more, as they say.
DeBank
 © DeBank
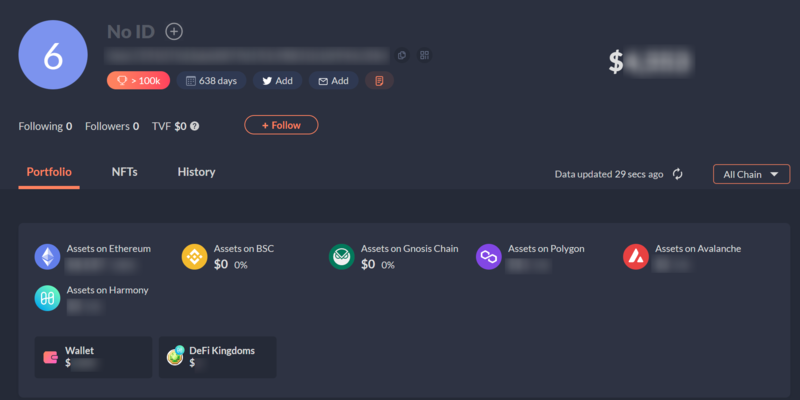
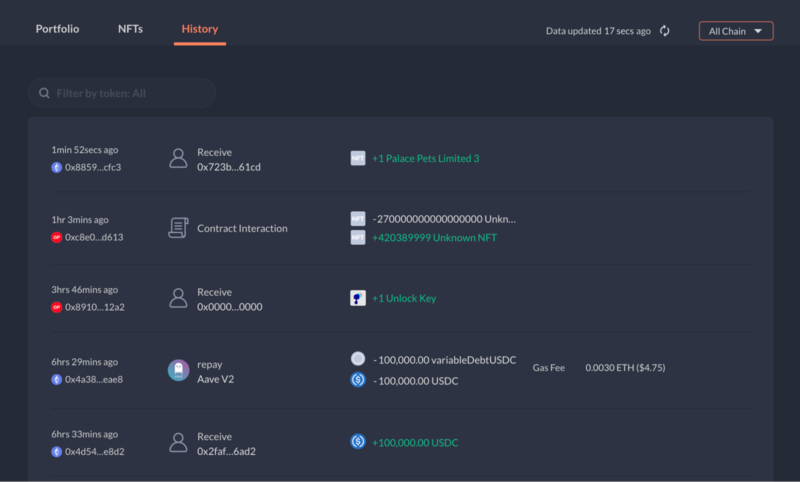
DeBank is a dashboard and a lifesaver. If you’ve been active on many chains for some time, there’s a chance you don’t actively track your crypto assets.
It’s understandable. Tracking all your assets can get overwhelming, real quick. It’s easy to use DeBank. All you’ve got to do to get started is to connect your wallet. Upon doing so, voilà!
Like a rabbit out of a hat, the dashboard reveals where anyone’s digital assets are located, and how much they’re worth, provided you know their wallet address. In fact, it’s a really great tool you can use to track literally any wallet.
 © DeBank
And we’re not just talking about digital assets in your portfolio. You can also check your NFTs, as well as gain a comprehensive historical overview of all your trades. DeBank supports more than 1,300 protocols, by the way, and is always adding more.
GeckoTerminal
 © GeckoTerminal
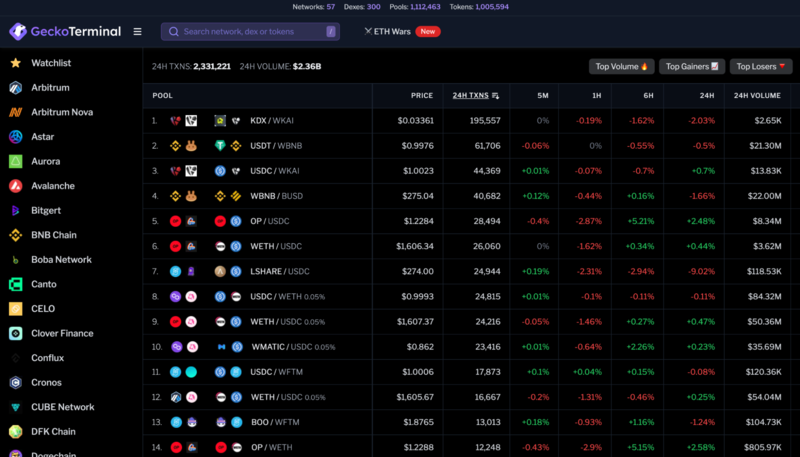
Founded by CoinGecko founders Bobby Ong and TM Lee, GeckoTerminal isn’t your average crypto charting tool. Unlike other charting tools, GeckoTerminal supports more than 50 chains, 300 DEXs, and >1 million tokens (and counting). And it’s got a gorgeous graphical user interface, to boot.
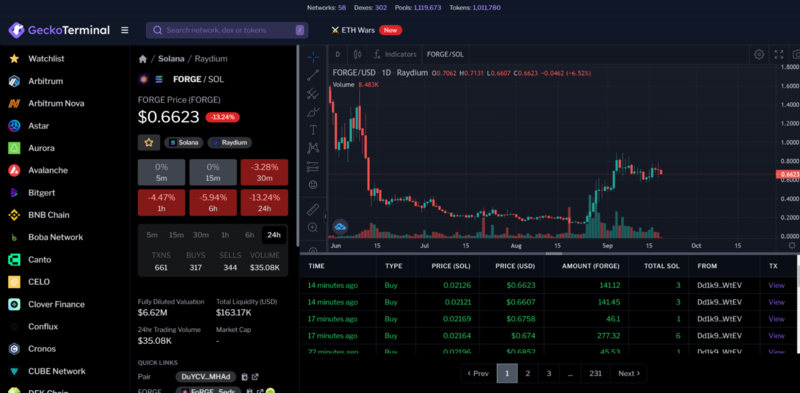
GeckoTerminal uses on-chain data to produce candlestick charts, line graphs, and many other charting styles and tools. Being only a few months old, it’s still in the alpha phase, but it’s completely free.
GeckoTerminal is incredibly intuitive to use. Simply look for a token you’re interested in. Once you find it, click on the token to pull up the chart. From here, you’ve got your standard charting tools available. On the bottom, though, you’ve also got a list of on-chain activity relating to the token, like when and in what amount the token was purchased, as well as by which address.
 © GeckoTerminal
As far as charting tools in the crypto sphere go, the future’s looking bright for this one. (If history is your teacher, you know the lesson: Don’t fade the CoinGecko team.)
Related: How to Read Candlestick Charts (Beginner’s Guide)
Final Thoughts
Considering how young blockchain technology is, there are soooo many crypto tools out there. In fact, when we first compiled our list, we had roughly 15 tools listed and had to trim it down to the best ones. Since we’re in a new industry, devs are always doing something.
But remember: Leaner is meaner.
We all know that a million random data points aren’t as helpful as a single actionable insight. And just a handful of powerful tools, integrated with a solid crypto strategy can really give you a massive edge over other crypto traders.
So get organized, get to learning, stay safe, and don’t forget to have fun!
To learn more about cryptocurrency and blockchain, visit CoinGecko Learn.
