
This article is brought to you by FBS.

Today, many people think that the altseason is approaching, but in fact — it has already arrived and is preparing to accelerate.
The long-awaited altcoin rotation is beginning. But this time, the playbook is shifting. What’s different? Why may it hit sooner than ever? And most importantly — how can you ride the wave instead of drown in it?
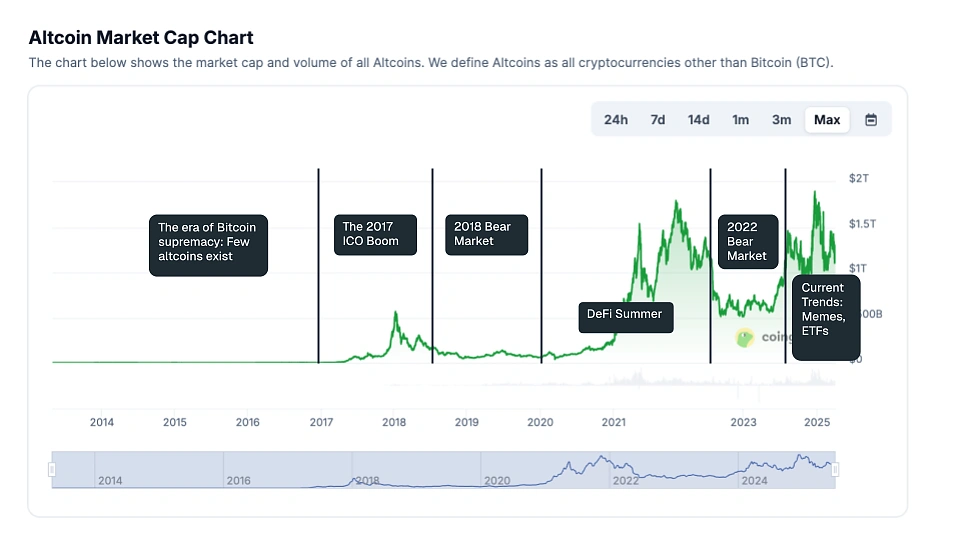
Total capitalization of the cryptocurrency market, excluding BTC
As you can see on the chart, the altcoin market cap is on the rise. In our opinion, this is not a rebound — it is a breakthrough, and if your portfolio is still bleeding red, you’re probably staring at the wrong coins. Capital is rotating quickly, and the market is already awake.
In this article, we’ll break down why the altcoin season is coming faster than anyone expected, and which altcoins have the best chance of success in the next few months.
4 Phases of the Crypto Market
Every crypto veteran knows the sequence of crypto market cycles. Bitcoin rallies, dominance spikes, retail chases momentum. Then the rotation starts — first into Ethereum, then Solana, and eventually into speculative corners of the market. This rotation, known as altseason, has played out in every major cycle since 2017. Now, it’s happening again — but on fast-forward.
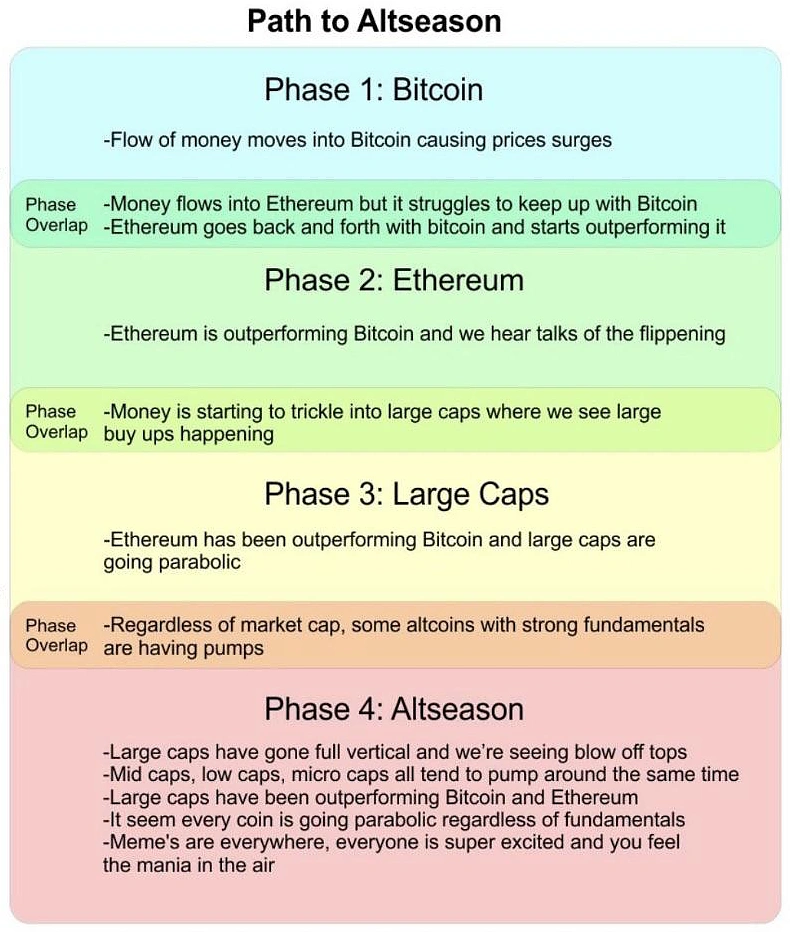
Phases of altseason
Вy mid 2025, BTC hit a new all-time high of $123,000 on July 14, driven by political tailwinds, ETF inflows, and macro clarity. Since then, Bitcoin has cooled around $117K–$120K. Historically, that’s when altcoins start to heat up, and signs are showing.
During Bitcoin’s last run to $123K, Ethereum was unusually quiet, and that confused a lot of people. If altseason always starts with BTC strength, the second act is supposed to be ETH catching up. But for weeks, that signal was missing. And then came May. ETH/BTC finally started to show signs of life – a classic ignition point for phase 2 of the crypto rotation. And from there, things began to shift.
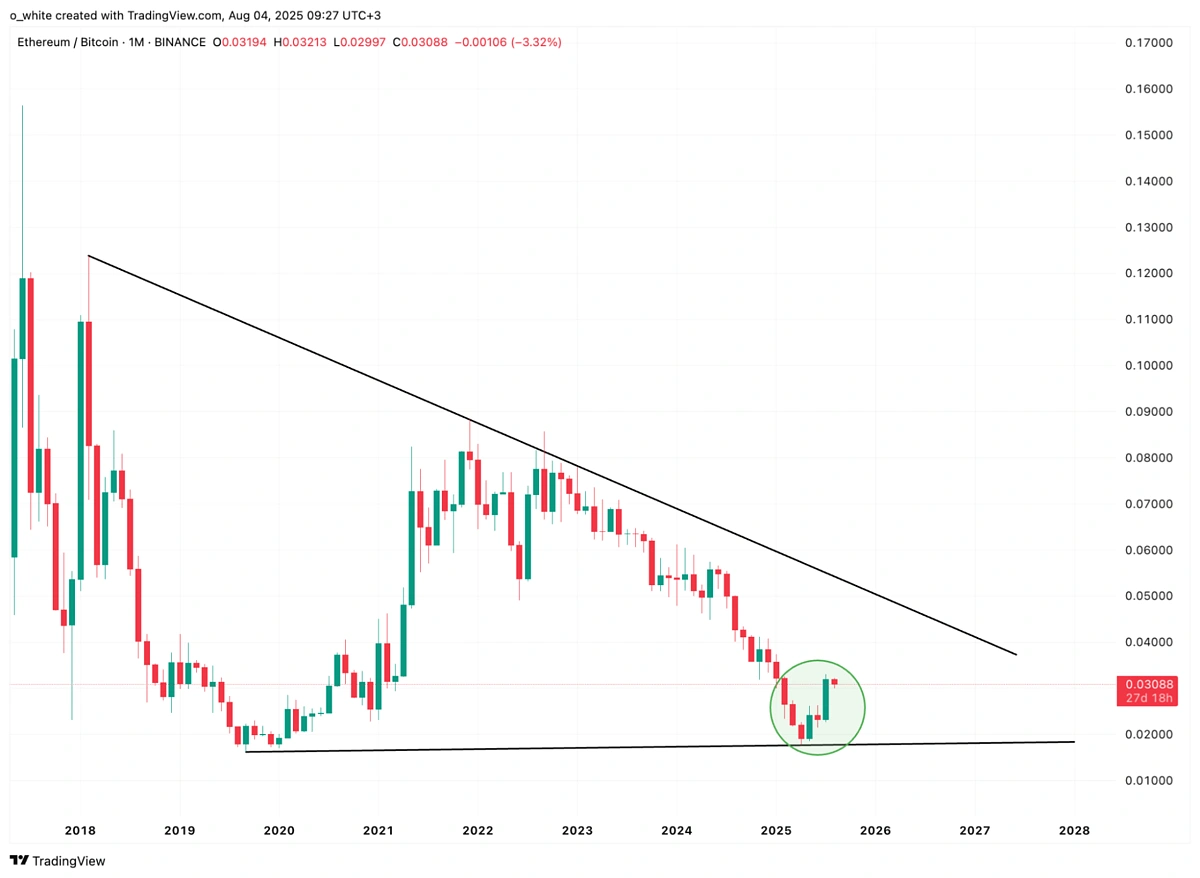
ETH/BTC chart
ETH/BTC starting to gain strength is a key signal we have been watching to indicate that we’re already in phase 2 of altseason. This is where Bitcoin stalls and capital begins flowing into Ethereum. And when ETH moves, everything else follows. Right now, that momentum suggests two things: either Ethereum itself becomes a high-conviction buy, or it’s time to start building a portfolio of top 10 altcoins before phase 3 rotation kicks in.
Altcoin Season Index: The Metric That Matters
The Altcoin Season Index tells a clearer story – it tracks whether the majority of top 50 altcoins are outperforming Bitcoin over the past 90 days. A score above 75 could mean a full-blown altseason. Below 25? Bitcoin still dominates.
Right now, the index is hovering around 45, rising from a deep Bitcoin season. Technically, this is a bullish reversal. The index bounced from a multi-cycle support zone, forming a clean V-shape recovery with momentum building. That’s a textbook early signal that capital is shifting away from BTC and toward the broader altcoin market.
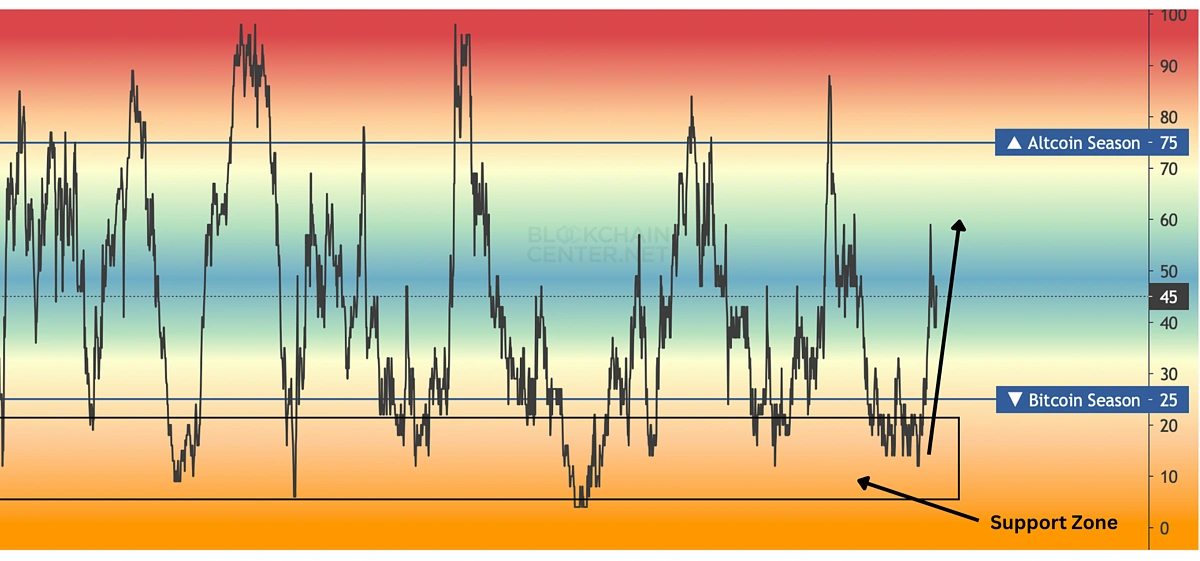
Altcoin Season Index
Historically, these reversals precede strong phase 3 rotations — the point where large-cap altcoins break out and liquidity flows into higher beta assets. If this trajectory continues, we may not have to wait for Q4. Phase 3 could hit as early as the end-August — weeks ahead of schedule.
A New Kind of Rotation
This cycle’s altseason doesn’t feel like the euphoria of 2021. Instead of TikTok fueled Dogecoin or Discord fueled rug pulls, the capital rotation is coming from more sophisticated players: crypto hedge funds, corporate treasuries, and TradFi market makers rotating from large cap tokens into higher beta names.
According to 10x Research, large wallets (>10,000 BTC) accumulated before the top and have since rotated capital into L1s and ETH staking – not for hype we think, but as a strategic reallocation.
Steve Kurz of Galaxy Digital said it best: “You move from the majors and then down the curve.”
But metrics alone don’t drive cycles. What’s changed under the hood is who’s driving the flow. This time, it’s not retail chasing charts. It’s institutions that may be reallocating their capital across crypto.
Institutions don’t tend to chase pumps. They reallocate across high-beta assets with asymmetric upside. That curve is already tilting toward altcoins. And that’s exactly where we are now: the curve is entering phase 3.
In this stage, institutional capital moves down from BTC to ETH, and possibly from ETH into strong large-cap and emerging high-beta alts – assets with liquidity, narratives, and asymmetry. That includes:
-
Solana (SOL) — still the go-to L1 for speed, with major ETF narrative fuel.
-
Chainlink (LINK) — alternative infrastructure with real market influence via CCIP and RWA exposure.
-
Hyperliquid (HYPE) — the first serious decentralized perp protocol gaining mindshare among pro traders, with on-chain volumes rivaling dYdX and strong early governance narratives.
The Stablecoin Effect: a False Signal Trap
As stablecoins grow, they distort altcoin dominance signals. Stablecoins like USDT and USDC are included in altcoin market cap, but they aren’t risk assets. During fear phases, capital may flow out of BTC into stables, lowering BTC.D and creating the illusion of an altseason.
That’s why stablecoin dominance charts like USDT.D and USDC.D are essential to confirm whether capital is rotating into altcoins or hiding from risk.
USDT.D and USDC.D are both falling sharply, down to 4.3% and 1.68%, from their 2023 peak near 9% and 5%, suggesting an increase in interest around altcoins.
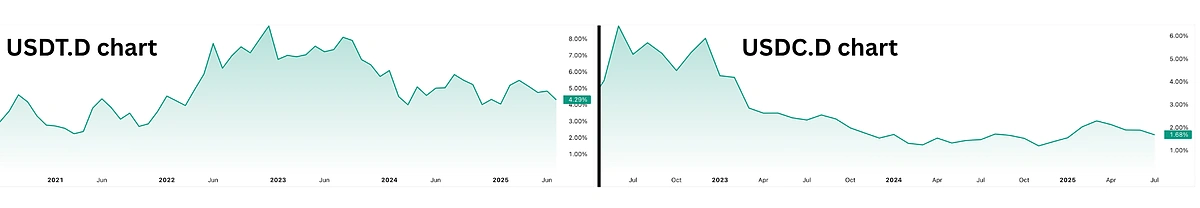
USDT and USDC Dominance charts
Capital is leaving safety, liquidity is being deployed, and the market is entering risk-on mode.
The Real Trigger Behind the Coming Altcoin Surge
The most powerful force driving the cryptomarket isn’t hype – it’s macroeconomy.
The US economy is softening fast, inflation is cooling, Non-Farm Payrolls are slowing, and the Fed is boxed in.
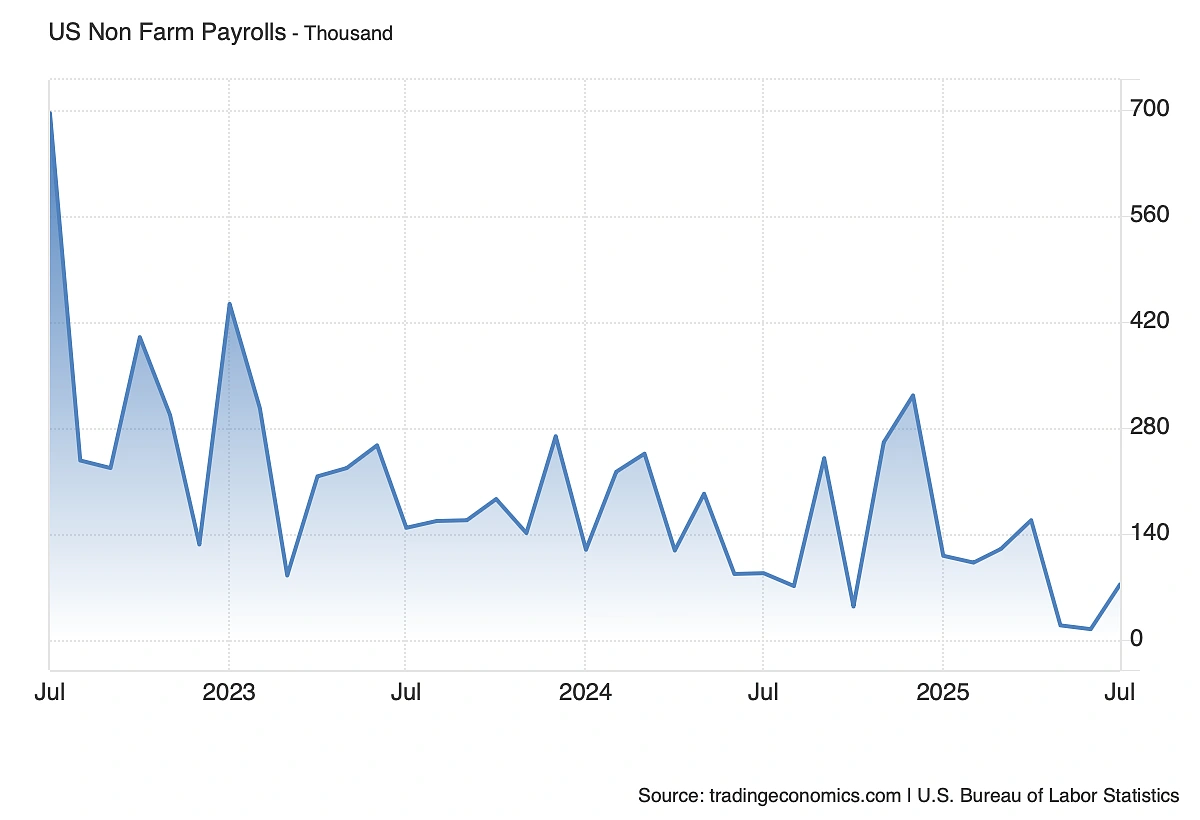
US Non Farm Payrolls (Thousand)
Behind the scenes, recession signals are flashing: job creation is declining, wage growth is slowing, and consumer strength is weakening. Even Trump has expressed frustration, openly calling for rate cuts to boost the economy ahead of elections. The Fed has not acted thus far, though the FOMC has three meetings left in 2025 and they already promised in December 2024, at least two rate cuts in 2025. Even if they didn’t do it yet, Jerome Powell already left the door wide open for that cut. Once cuts come in, liquidity will return to the market, and the effect on risk assets, especially crypto, is historically explosive.
Looking back at 2024: after the first rate cut, altcoins didn’t just rise – they skyrocketed. Many large caps coins showed growth of 200–300% within months, fueled by renewed flows. This isn’t wishful thinking. It’s macro math.
As Christine Fang of PSE Trading puts it:
“We will see an extended alt rally if the US macro stays clear and BTC holds.”
M2 Matters More Than Anything
Forget memes, narratives, or even Bitcoin dominance – global liquidity is the one indicator that rules them all. The best proxy for it is M2 money supply.
M2 measures how much liquid cash exists in the system, cash that can flow into stocks, bonds, crypto, or just sit on the sidelines. When M2 grows, risk assets rise.
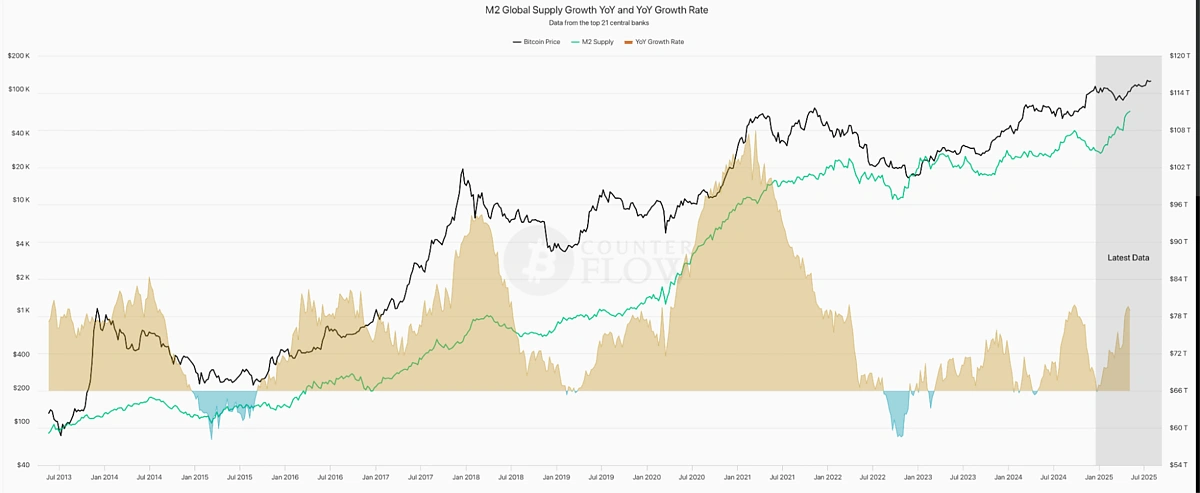
M2 Global supply growth vs Bitcoin price
The chart above shows it perfectly: Bitcoin has always followed M2 growth — with a 4 to 6-month lag. In every major cycle, a surge in global M2 precedes a breakout in BTC. That’s not correlation – that’s flow mechanics.
Now, M2 is rising again. We’re seeing the fastest rebound in global liquidity since early 2021, exactly the same conditions that launched one of the previous altseason. And BTC is already responding. But here’s the catch: altcoins may be even more sensitive to liquidity than Bitcoin. Why? Because they’re smaller, more volatile, and more speculative. That’s why every major alt rally: 2017, 2021 – came after M2 growth turned up. In short: historically M2 leads, BTC follows and alts explode last. And based on current M2 trajectories, we are watching that explosion in motion.
Top 3 Altcoins to Watch Right Now
Solana (SOL)
Backed by massive ecosystem momentum, Solana is a top contender of non-EVM chains being seriously considered for a US ETF. Its combination of speed, real-world adoption (Visa, Shopify), and growing meme culture makes it a high-beta L1 play institutions won’t ignore.
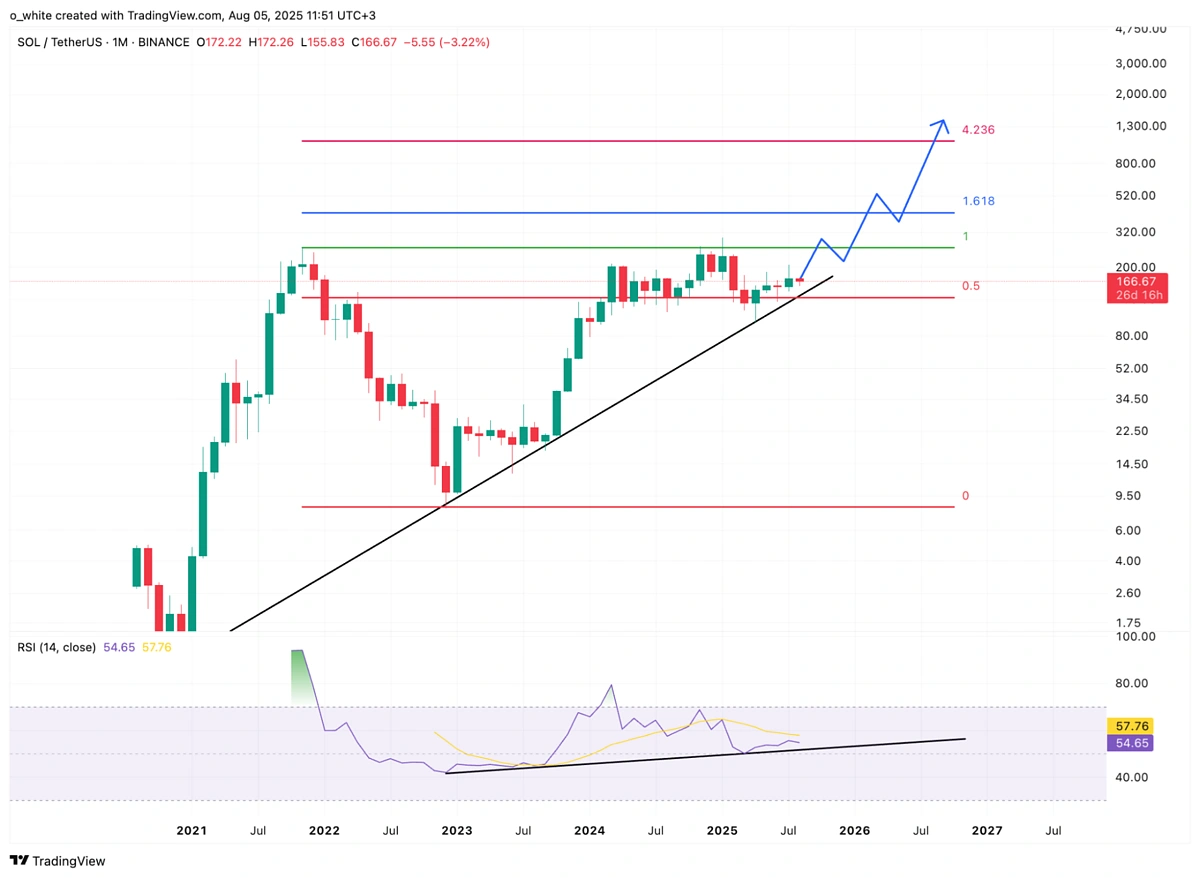
SOL/USDT Monthly Chart
Solana is forming a powerful ascending triangle on the monthly chart – holding above trendline support. RSI is following an uptrend as well, confirming internal strength. If SOL breaks above the $210–$220 zone, the next Fibonacci targets land near $420 (1.618) and $1300 (4.236) – opening the door for a potential 6–8x move. The longer the base, the higher the breakout.
Chainlink (LINK)
Chainlink is quietly becoming the core infrastructure for real-world asset tokenization. With CCIP going live in major banks and BlackRock tapping into tokenized treasuries, LINK is finally gaining the narrative it never had in 2021.
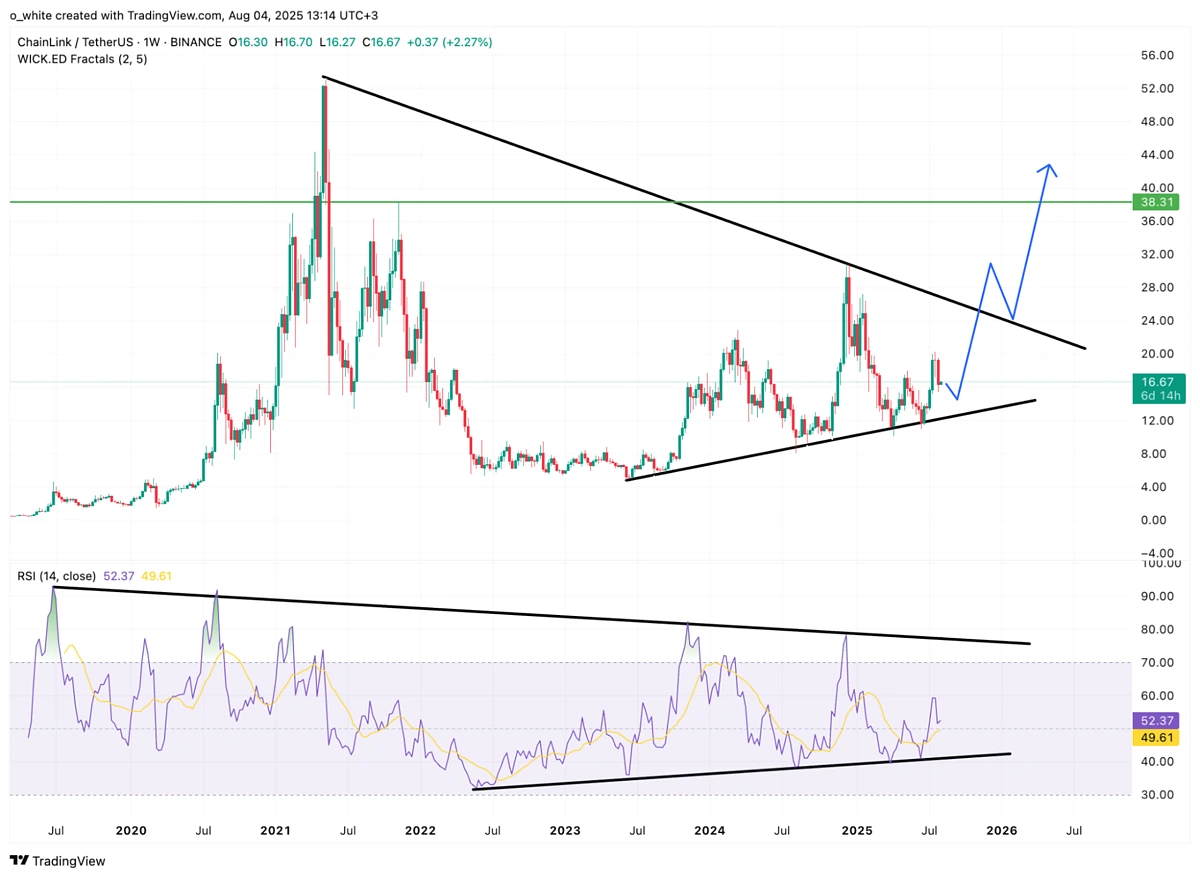
LINK/USDT Weekly Chart
Chainlink is coiling inside a massive multi-year symmetrical triangle and it’s nearing the apex. Weekly RSI is forming a textbook bullish divergence, mirroring the 2020 breakout setup. If price holds the rising trendline, a breakout toward $38–44 becomes not just possible – but likely inevitable.
Hyperliquid (HYPE)
As the first serious decentralized perpetuals exchange with zero fees and near-CEX experience, Hyperliquid has attracted pro traders fast, and its volume growth already rivals dYdX, but with 1/10th the valuation.
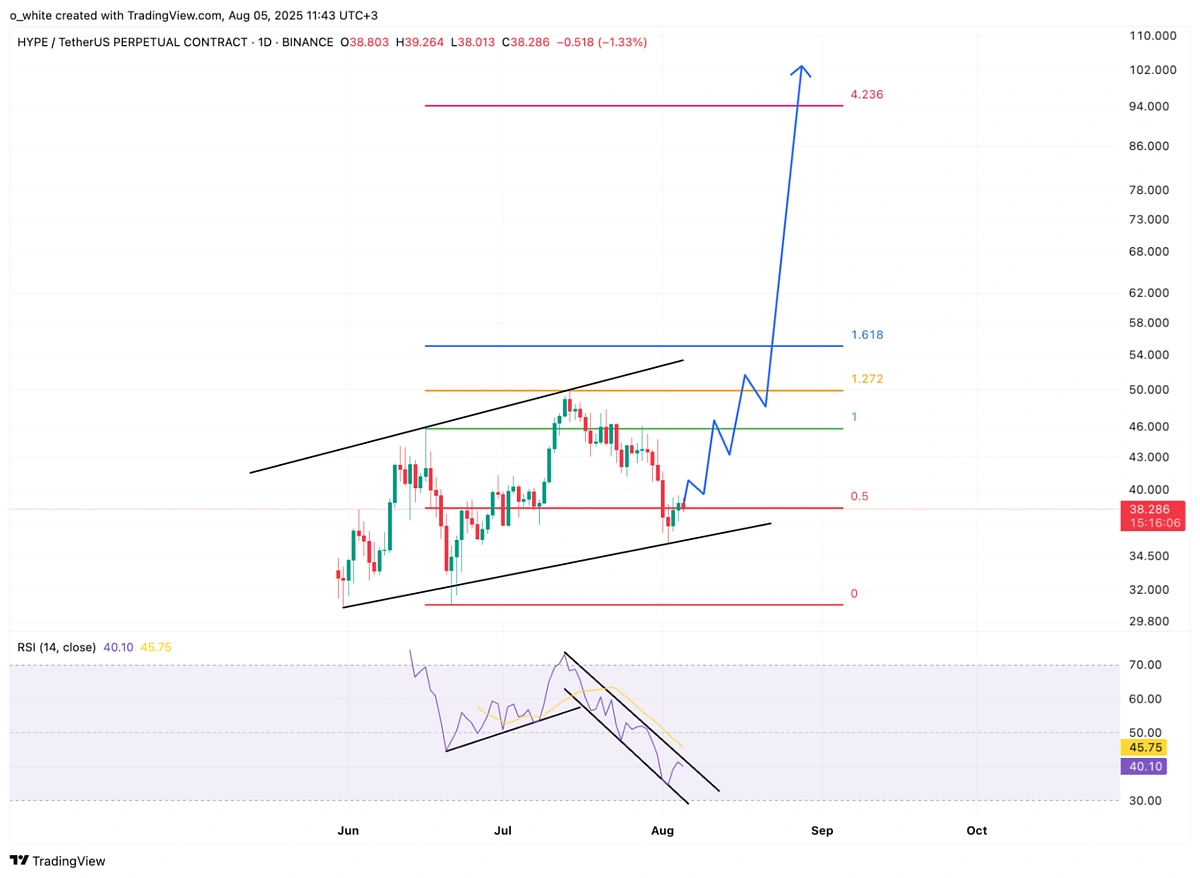
HYPE/USDT Daily Chart
HYPE just tagged the 0.5 OTE Fibonacci zone while printing a huge falling wedge on the daily RSI, more than the price itself, which bounced from the trendline. If price breaks above $40 level cleanly – targets at $50 (ATH), $56 (1.618 extension), and even $100 (4.235 extension) will come into play fast. It’s a low-float altcoin sitting on rocket fuel.
Conclusion
Altseason isn’t just coming – it’s already halfway through. The signals are clear: Ethereum has awakened, stablecoin dominance is collapsing, macro liquidity is rising, and institutional capital is already rotating into high-beta plays. If you’re still sitting on the sidelines, waiting for “confirmation,” understand this – smart money rotates early, dumb money buys tops.
This article is by FBS analysts and is not intended to serve as investment or financial advice. Always do your own research before investing in any cryptocurrency.