
Token holder history is a great indication of adoption or growth for a cryptocurrency. This information offers great insight into how decentralised the token governance is and how well distributed the value is.
Especially for new or smaller tokens, understanding token holders growth, and the average amount per holder is a great indicator of trust and that the project may be legitimate.
In this article, we’re going to explore CoinGecko’s new Token Holders endpoints, built to simplify querying token holder data across multiple networks. Specifically, we’re going to look at Token Info, Top Token Holders, and Historical Holders Chart endpoints to explore the various token-related information available on the blockchain.
We’re also going to explore potential use cases for this, whether from a security, research, or investment perspective.
Prerequisites
-
A CoinGecko API Key
-
Python 3.11 +

Obtaining a CoinGecko API Key
To obtain a CoinGecko API key, navigate to the Developer’s Dashboard and click on “+Add New Key” in the top right corner. For detailed instructions on generating and setting up your key, refer to this guide.
The token info endpoint is free to use; however, you will need an Analyst tier or above for Top Token Holders and Historical Holders Chart.
How to Fetch Total Holder Count
The total number of holders of a cryptocurrency is a valuable on-chain metric that can serve as a strong indicator of both the legitimacy and adoption of a project. A high holder count often suggests that the token is in demand, has gained significant traction, and is backed by an engaged community.
One of the easiest ways to access this metric across multiple blockchain networks is by using CoinGecko’s Token Info by Token Address endpoint. This free-to-use API provides a comprehensive set of data for any token, given its contract address and the corresponding network ID. Among the data returned is the holder count, which can be critical for assessing community strength and token distribution.
To integrate this into your workflow, consider creating a lightweight Python wrapper around the endpoint. A clean approach is to define a CoinGecko class with relevant methods for interacting with the API. Since you’ll need to authenticate requests, it’s best to pass your API key via the constructor when instantiating the CoinGecko object:
You can then instantiate the class object and call the get_token_info method, like so:
Here we’ve passed the network ID “eth” along with a token_address. This address is for the DAI token on the Ethereum network. To access the holders, use the dot notation on our typed return object, to get the following output:
The network ID is a CoinGecko-specific identifier used to represent a particular blockchain network. While it often aligns with the network’s common abbreviation (e.g., eth for Ethereum, bsc for Binance Smart Chain), this isn’t always consistent, so it’s important to refer to CoinGecko’s documentation or data for the correct values.
Luckily, CoinGecko provides a free API endpoint that returns a list of network IDs. This is particularly useful in use cases where you are required to pass the network ID to another CoinGecko endpoint, like we’ve done in the example above.
A clean way to build this in would be to add another method to our CoinGecko class, like so:
You can retrieve the list of available network IDs by calling cg.get_network_id_list(). To minimise the number of API calls, it’s best to fetch this data once and store it locally, either as an enum or a JSON object, depending on your use case.
Once you have the correct network_id, you can pass it to cg.get_token_info(). You might have noticed that we’re casting the response to a TokenInfo object like so:
return TokenInfo.from_dict(response)
This approach allows us to define a structured return type for the endpoint, giving us clarity on what kind of data to expect. This is essential for keeping your codebase readable, maintainable, and type-safe.
It also enables intelligent code completion in your IDE through dot notation, letting you easily access nested properties, for example: data.attributes.address.
Here is a fully typed example of the TokenInfo return object:
When evaluating the validity or legitimacy of a lesser-known project, it’s important to consider the token holder count in the context of other key metrics. While a high number of holders can signal demand, it’s technically possible to create a token and distribute it to many wallets at low cost, so this metric alone isn’t always a reliable indicator.
How to Fetch Token Distribution Data
When you fetch the token holder information, the return object also includes useful distribution information. For instance, take a look at the following response:
The count field tells us the total number of holders. This is a helpful metric for gauging a token’s overall adoption. However, raw holder count alone lacks nuance. For example, a token could have a high number of holders but still be heavily concentrated among a few wallets. That’s where the distribution_percentage object becomes more insightful.
This field breaks down ownership into four key segments:
-
Top_10: The percentage of tokens held by the top 10% wallets.
-
11_30: The percentage held by wallets ranked 11 to 30%.
-
31_50: The percentage held by wallets ranked 31 to 50%.
-
Rest: The percentage distributed among all remaining wallets (the bottom 50% in terms of holdings).
In our example, the top 10% of wallets hold approximately 61.9% of the total supply. This level of concentration could stem from several factors, including early investor allocations, developer treasury wallets, centralised exchange cold wallets, or large individual holders (commonly referred to as whales).
It’s important to note that while these figures offer a snapshot of token distribution, they don’t tell the full story. To truly assess decentralisation, you need to understand who the wallets belong to. For instance, if many top wallets are controlled by the project team or a few entities, the token may be significantly centralised, even if the holder count appears high. On the other hand, if those wallets represent exchange addresses or smart contracts used by many users, the actual distribution could be more equitable than it seems.
Naturally, because of how this data is structured, it serves as a powerful indicator for assessing a project’s distribution and decentralisation levels. You could use it to power a real-time dashboard displaying a live decentralisation index, or plot it over time to show how a token’s distribution has evolved historically.
Other valuable use cases include:
-
Whale tracking: Monitor the top 10 holder percentage over time to detect whale movements. A sudden increase might indicate accumulation; a drop could suggest selling pressure.
-
Exchange listing due diligence: Platforms can use this to assess whether a token is too centralised to list, helping reduce the risk of manipulation or rug pulls.
-
Governance planning: Projects can design better voting mechanisms by understanding how power is distributed. If a few wallets dominate the supply, standard voting may not be fair.
-
Investor risk assessment: Portfolio tools can use this data to flag tokens with high concentration, helping users understand hidden risks in their holdings.
How to Fetch Top Token Holders
Understanding who the top holders are is the final, crucial piece that completes the picture. Whether you’re evaluating a project’s decentralisation or verifying its legitimacy, identifying the top token holder addresses adds an important layer of context to the dataset.
To fetch this information, we’re going to use CoinGecko’s Token Holders by Token Address endpoint. We’re going to add a new method to the CoinGecko class:
As before, all we need to do is call cg.get_top_token_holders() and pass in the appropriate information:
The output is a list of token holders showing the wallet address, amount owned, percentage from total supply and value:
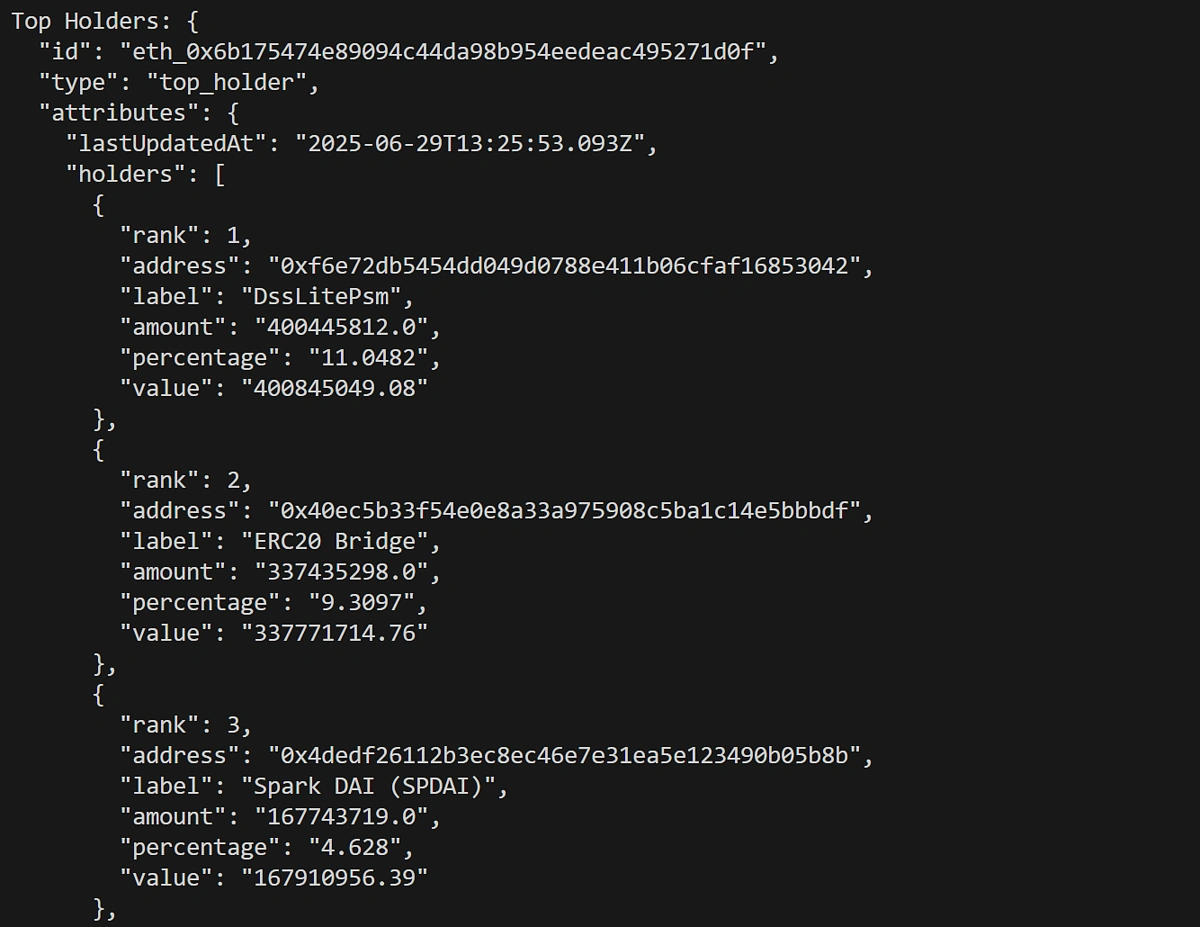
With this information at your fingertips, it’s very easy to get an idea of how concentrated or decentralised a token’s ownership really is. You can quickly spot if the majority of tokens are controlled by a few large holders or if the distribution is more evenly spread out among smaller participants.
This kind of visibility is essential for evaluating risk, trustworthiness, and the long-term sustainability of a project. It also helps investors, analysts, and developers make informed decisions around governance, tokenomics, or integration with other protocols.
As with the token info response, the best way to work with this information is in a structured, strongly typed format. In the above example, we’re returning an object of type TopHolderData. This lets us query using dot notation and enables type hinting in our IDE.
How to Fetch Historical Token Holders Chart
Now that we’ve explored total token holders, distribution breakdowns, and top holder insights, let’s take it a step further by looking at how to retrieve historical token holder data using CoinGecko’s Historical Token Holders Chart by Token Address endpoint.
We’ll add another simple function to our CoinGecko class that returns an object of type HistoricalHolders. This is essentially a list of values, but we’ve typed it for ease of use.
We then call the function and print the response:
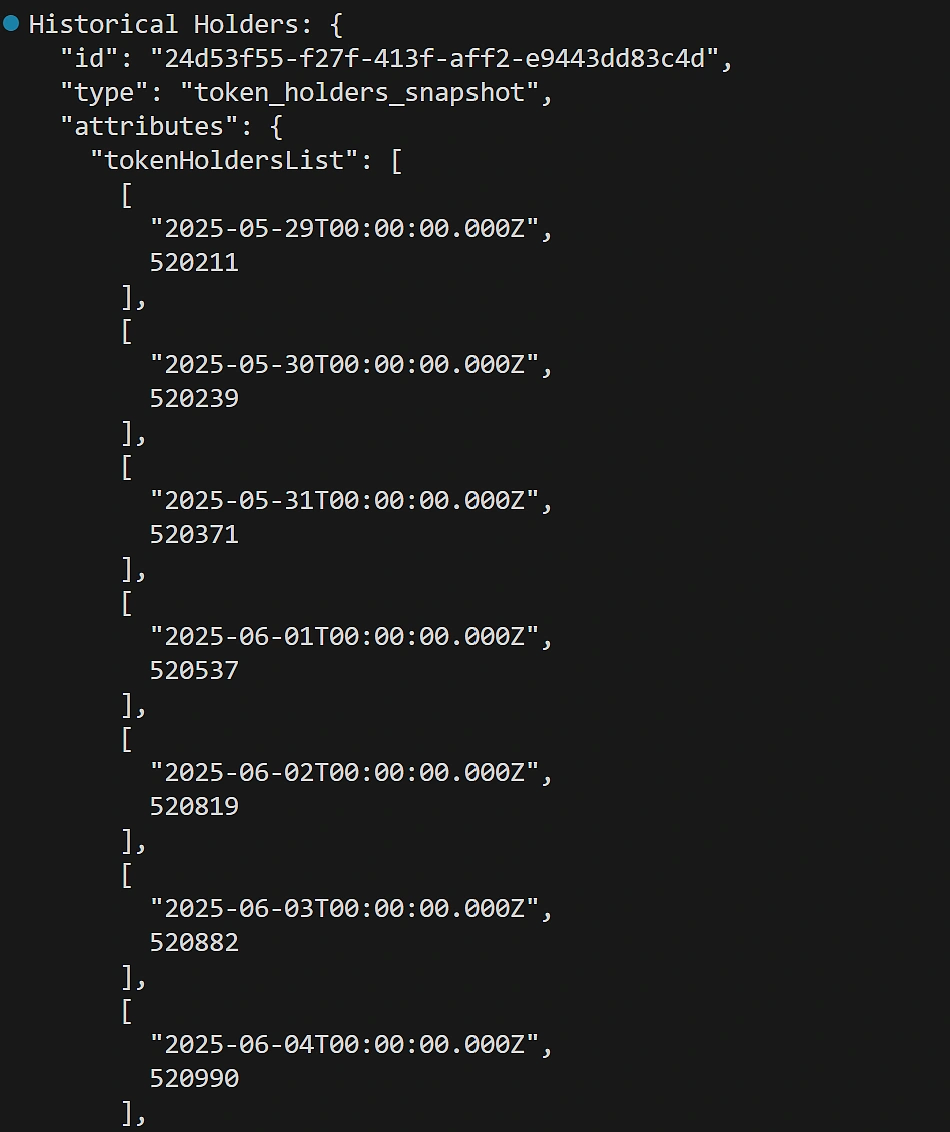
The response for this endpoint looks like this:
How to build a token holder chart
It’s clear that the data is meant to be plotted in a time-series format, and that it’s not very readable in this format. An easy way to visualise this data is to use Python’s matplotlib library:
Note that, because each value in the list returned by the historical holders endpoint is a tuple, with the date as the first item and the value as the second item, we’ve had to save the dates and values in separate comprehension lists.
We’ve also had to apply some light formatting on the date so that it displays correctly on the X axis.
With that out of the way, we’re ready to import the plotter into our main executable file and pass our data for charting:
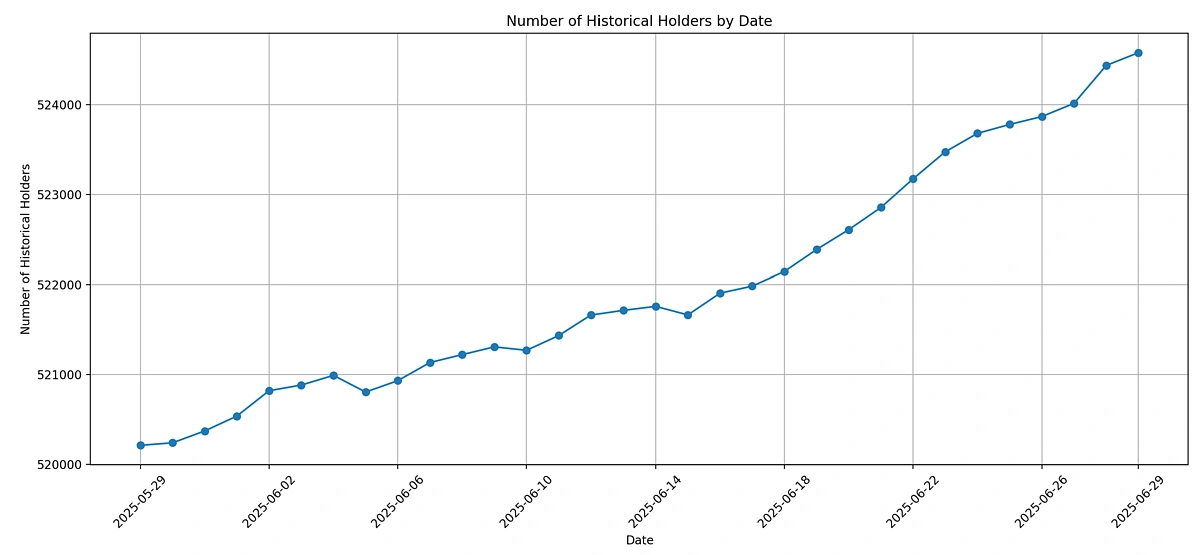
The output will give us a graph, plotting the total value of token holders for the last 30 days:
As in the previous two examples, it’s best to document the object you’re working with. In this case, the Historical Token Holder Chart endpoint returns an object that can be mapped like so:
Conclusion
CoinGecko’s new Token Holders endpoints make it significantly easier to access and analyse on-chain distribution metrics across multiple networks, all through a single, unified API.
Whether you’re a researcher evaluating decentralisation, an investor assessing risk, or a builder creating dashboards and analytics tools, these endpoints open up a wealth of insights.
By combining holder counts, distribution breakdowns, and top wallet visibility, you can form a more complete and accurate picture of a token’s trustworthiness and ecosystem health. As the crypto space continues to evolve, having access to this kind of granular, cross-chain data will only become more critical.