
Where Is Bitcoin Headed In 2025?
In 2025, Bitcoin has already broken into six figures. Most forecasts are in the $180K – $250K range, with some extreme cases stretching toward $500K or even $1M. The key drivers are institutional inflows, with a historical post-halving cycle that points to late 2025 as the likely peak window.
Key Takeaways
-
2025 Bitcoin predictions range from $145K on the conservative side to $1M+ in the most bullish cases, with consensus clustering around $180K–$250K.
-
ETFs, 401(k) access, and corporate treasuries are creating sustained buy pressure and reducing available supply.
-
Regulatory clarity (GENIUS Act, SEC’s Project Crypto) and favorable monetary policy (rate cuts, liquidity expansion) are fueling optimism.
-
Growth in BTCFi, yield products, and treasury adoption is turning Bitcoin into a broader financial ecosystem beyond just “digital gold.”
-
Historical halving cycles suggest a late 2025 peak, but risks of volatility, black swan events, and a potential 2026 “crypto winter” remain.

According to a CNBC feature, $100K is no longer enough for the American dream. But maybe 1 BTC is!
In 2025, Bitcoin is rewriting what “life-changing money” means. With Wall Street ETFs pulling in billions, the halving tightening supply, and global adoption creeping into crypto payment systems like credit cards, the question isn’t if Bitcoin can hit six figures but how far beyond it we can go. Some analysts see $200K on the horizon, while others boldly forecast $1 million.
Price predictions are everywhere. But knowing what’s credible, and why, can make all the difference.
Disclaimer: This article is for informational purposes only. Cryptocurrency markets are highly speculative. CoinGecko does not provide any financial advice.
Rounding Up The Price Predictions
Why are Bitcoin predictions the most sought-after? Is it because other coins don’t matter? Not at all. Historic trends show that when BTC rallies strongly, altcoins often experience larger percentage gains. However, this relationship isn’t guaranteed, and can vary significantly across market cycles.

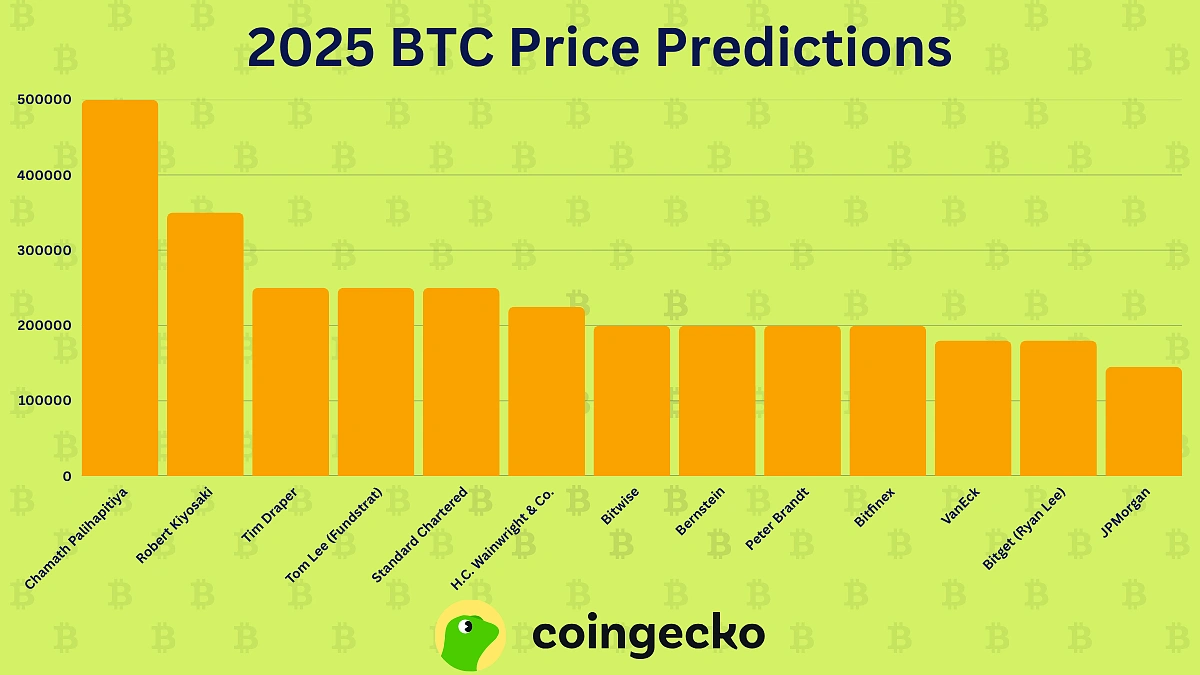
On the “safe” side of the crystal ball, we have institutional analysts with targets in the $145K–$250K range.
Then there are the technical analysts who rely on chart patterns, trend analysis, and other mathematical indicators. They’re predicting prices as high as $340K.
And then there are the Bitcoin maxis and moonshot seekers with predictions well above $500k and into the seven-figure territory.
The table below rounds up the major 2025 Bitcoin predictions from prominent analysts and institutions.
|
Analyst/Firm |
Prediction |
Target Date |
Core Rationale |
|
Michael Saylor (Strategy) |
$21,000,000 |
2046 |
Growing positive regulatory and legislative developments around crypto. |
|
Cathy Wood (ARK Invest) |
$1,500,000 (2027) $3,800,000 (2030) |
2027-2030 |
Bull case, institutional adoption due to low correlation with traditional assets |
|
>$200,000 (2025) $1,300,000 (2035) |
2025-2035 |
Institutional adoption, BTC scarcity, and inflation-hedge demand. |
|
|
Brian Armstrong (Coinbase CEO) |
$1,000,000 |
2030 |
Regulatory clarity, US Government’s BTC Reserve, Crypto ETFs. |
|
$1,000,000 |
End of 2025 |
Violent supply shock from ETF demand, institutional and nation-state adoption. |
|
|
$500,000 |
October 2025 |
Bitcoin as a potential global reserve currency; decentralization and scarcity. |
|
|
$250,000 |
By 2025 |
Hedge against traditional financial uncertainties and fiat debasement. |
|
|
$250,000 |
End of 2025 |
Political and regulatory drivers, along with increased institutional adoption. |
|
|
$150,000 – $250,000 |
End of 2025 |
Post-halving supply shock, global liquidity expansion, dovish Fed policy. |
|
|
$200,000 – $250,000 |
End of 2025 |
Massive ETF inflows, portfolio shifts away from U.S. assets, pension fund uptake. |
|
|
$225,000 |
End of 2025 |
Accelerating institutional/corporate adoption via ETFs, favorable regulation. |
|
|
$200,000 |
Early 2026 |
Stronger-than-expected ETF inflows herald a “new institutional era.” |
|
|
$125,000 – $280,000 |
By September 2025 |
Technical breakout from long-term channel, historical cycle analysis. |
|
|
$145,000 – $200,000 |
Mid 2025 |
Favorable macro (Fed rate cuts), breaking technical resistance. |
|
|
$180,000 |
During 2025 |
Historical four-year cycle patterns, capturing share of offshore wealth. |
|
|
$180,000 |
End 2025 |
Optimistic outlook driven by spot ETF inflows, post-halving supply tightening, and institutional entry |
|
|
$145,000 |
Long-Term |
Comparison to gold’s market capitalization, Lightning Network growth. |
Below is a visual representation of major BTC price predictions for 2025.
Key Drivers Behind Bullish 2025 Predictions
What exactly is fueling these optimistic forecasts? On the whole, there are more reasons for optimism than we could possibly count. However, there appears to be a few repetitive sets of bullish drivers:
-
Supercharged institutional adoption
-
Bullish macroeconomic conditions
-
Bitcoin ecosystem growth
-
Rise of corporate Bitcoin treasuries
-
Historical cycle patterns
Supercharged Institutional Adoption
Ironically, TradFi firms that once wore the crown of anti-Bitcoin now seem to be pouncing at every opportunity to ‘present’ their Bitcoin price prediction.
JPMorgan was one of the first big banks to come up with a headline-grabbing number. Back in 2021, JP Morgan strategists said Bitcoin could trade at $146,000 in the long run if it captured a share of the gold market as an alternative store of value.
Interestingly, JPMorgan framed this as a long-term theoretical price (with the caveat that Bitcoin’s volatility would need to converge with gold’s to sustain such a valuation).
Other banks have turned even more bullish in light of recent developments. In mid-2025, Standard Chartered went back on its prediction only to counter with a more bullish case. Geoff Kendrick, the bank’s head of digital assets, had initially forecast around $120K Bitcoin by mid-2025, but as the market surged above $100K earlier than expected, he publicly admitted to underestimating the asset and indicated $200K or more by December 2025 was now feasible.
 Source: The Daily Hodl
Following Standard Chartered’s price prediction, many other firms, too, have come up with predictions in the lower-$200Ks, citing institutional adoption as a major driver.
-
Bernstein Research has a ‘conservative’ $200,000 price target for the end of 2025
-
H.C. Wainwright, an investment bank, updated its 2025 forecast from $145K to $225,000 after the U.S. 2024 elections
-
Bitwise Asset Management’s CIO, Matt Hougan, commented in April 2025 that he still thinks $200,000 by December is in play
MATT HOUGAN: “If the Fed or Treasury steps in… it’s off to the races.”
Bitwise CIO thinks $200K #Bitcoin is still in play in 2025. 🚀 pic.twitter.com/XZmJhD4Bsx
— Swan (@Swan) April 21, 2025
Bullish Macroeconomic Conditions
While Bitcoin’s core narrative has always been about decentralization and scarcity, the 2025 macro backdrop has done it a huge favor.
The White House signed the GENIUS Act in July, giving stablecoins a federal playbook and clearer protections for holders. While the opinions may be polarized, you’d have to agree that clarity reduces headline risk and makes big-money allocators more comfortable touching the asset class. Then in August, Trump signed an executive order letting 401(k) plans include Bitcoin (and other crypto assets), which could invite trillions of dollars in new inflows (into crypto) and drive BTC price beyond $150,000 before the year ends.
Very recently, the SEC’s Project Crypto aims to modernize securities rules so more of Wall Street’s plumbing can move on-chain. If even a slice of issuance, custody, and settlement migrates to blockchain rails, the legitimacy and distribution channels that follow are a boon to Bitcoin’s narrative. And according to Matt Hougan from Bitwise, the impact of this project will be felt over the next decade (not immediately).
What you could take away from this is that monetary policy and regulatory clarity are aligning in a way Bitcoin hasn’t seen before, and the market is already starting to price it in.
Key Price Targets from Macro Tailwinds
|
Catalyst |
Analyst / Source |
2025 Price Target |
|
401(k) retirement plan access for Bitcoin |
Multiple market strategists |
$150K+ by end-2025 |
|
GENIUS Act stablecoin clarity |
Institutional research desks |
Adds stability to sustain $150–$175K range |
|
SEC’s Project Crypto regulatory overhaul |
Bitwise CIO Matt Hougan |
Long-term bullish, foundation for $200K+ in next cycle |
|
Combined macro easing + policy tailwinds |
Consensus of bullish forecasts |
$175K–$200K possible in 2025 |
|
Outlier high-liquidity scenario |
Select fund managers (e.g., Arthur Hayes) |
$250K+ potential in parabolic run |
Bitcoin Ecosystem Growth
Bitcoin is evolving into a financial ecosystem with the growth of BTCFi, yield-generating products, and infrastructure that institutional investors also trust.
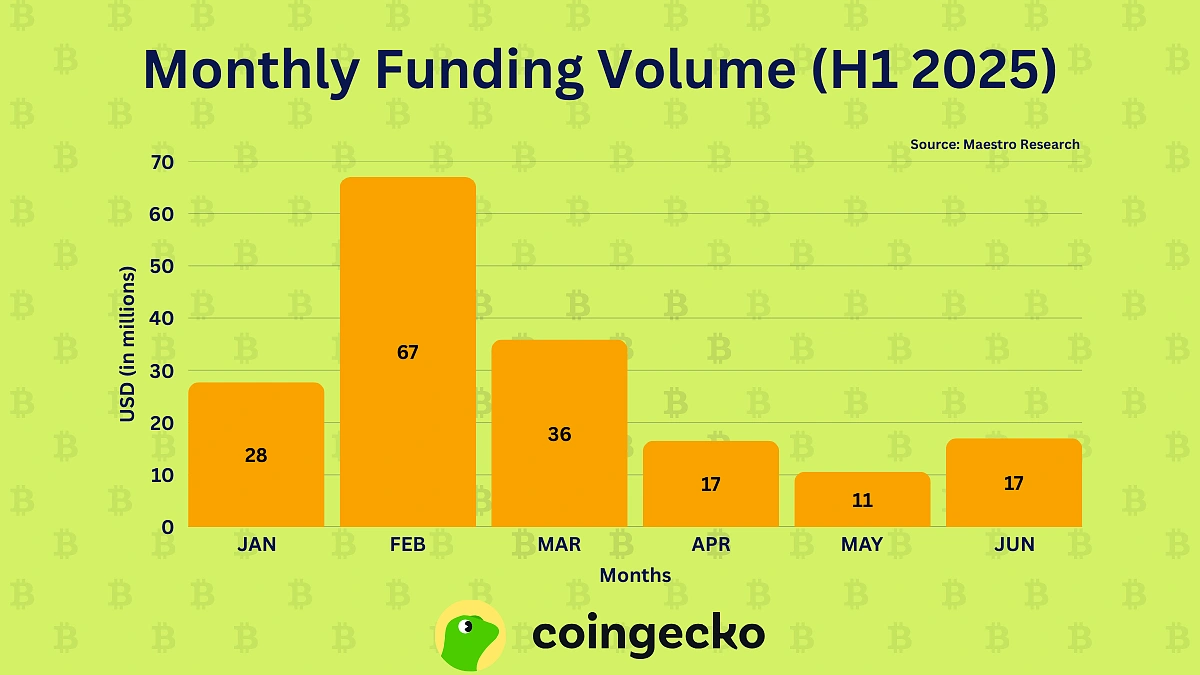
Bitcoin is largely dormant (over 14 million BTC sit idle). BTCFi (short for Bitcoin DeFi) changes that by unlocking yield through lending, staking, and consumer-facing apps. In the first half of 2025 alone, $175 million in VC funding flowed into the BTCFi space, which clearly implied there’s interest in making BTC an asset that’d help generate income.
Within a year, Total Value Locked (TVL) in Bitcoin DeFi surged by over 12 times to about $7.5billion at time of writing, resulting in analysts seeing explosive growth of 300x if even a bit more capital is mobilized from the current 0.1-0.8%.
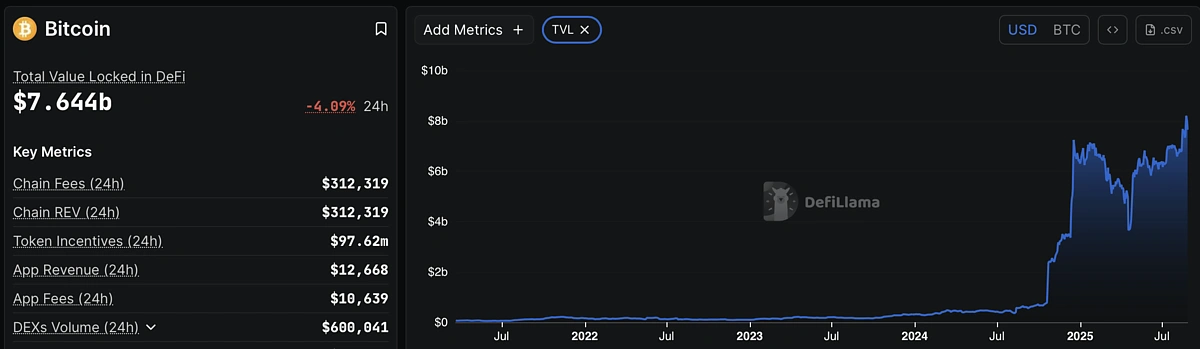
Source: DefiLlama
Rise of Corporate Bitcoin Treasuries
Many companies, in 2025, are turning Bitcoin into a core treasury asset, raising capital specifically to buy BTC and hold it long term. That does two big things for the price:
-
It soaks up the circulating supply
-
Creates a loop where rising prices drive more buying
When price rises, balance sheets strengthen, which lets these firms raise more capital and buy more coins, which tightens supply again.
And with rising BTC treasuries, the float is also shrinking (meaning fewer coins are left in circulation for trading as more are locked up by corporate treasuries). Multiple datasets now show public-company BTC balances have crossed the $100 billion mark and sit at over 4 percent of total supply, a steep jump from a year ago. That includes Japan’s Metaplanet, which has been steadily adding coins and now holds more than 18,000 BTC, plus a growing list of U.S. miners and non-crypto corporations.
With public and private companies pushing their combined holdings from roughly 4% to over 7% of supply, that implies tens of billions of incremental demand at current prices, with a historically tight post-halving supply to meet it.
Long story short, corporate treasuries reduce floating BTC, legitimize the asset for traditional finance, and strengthen the case for $180K–$200K base-case targets in 2025.
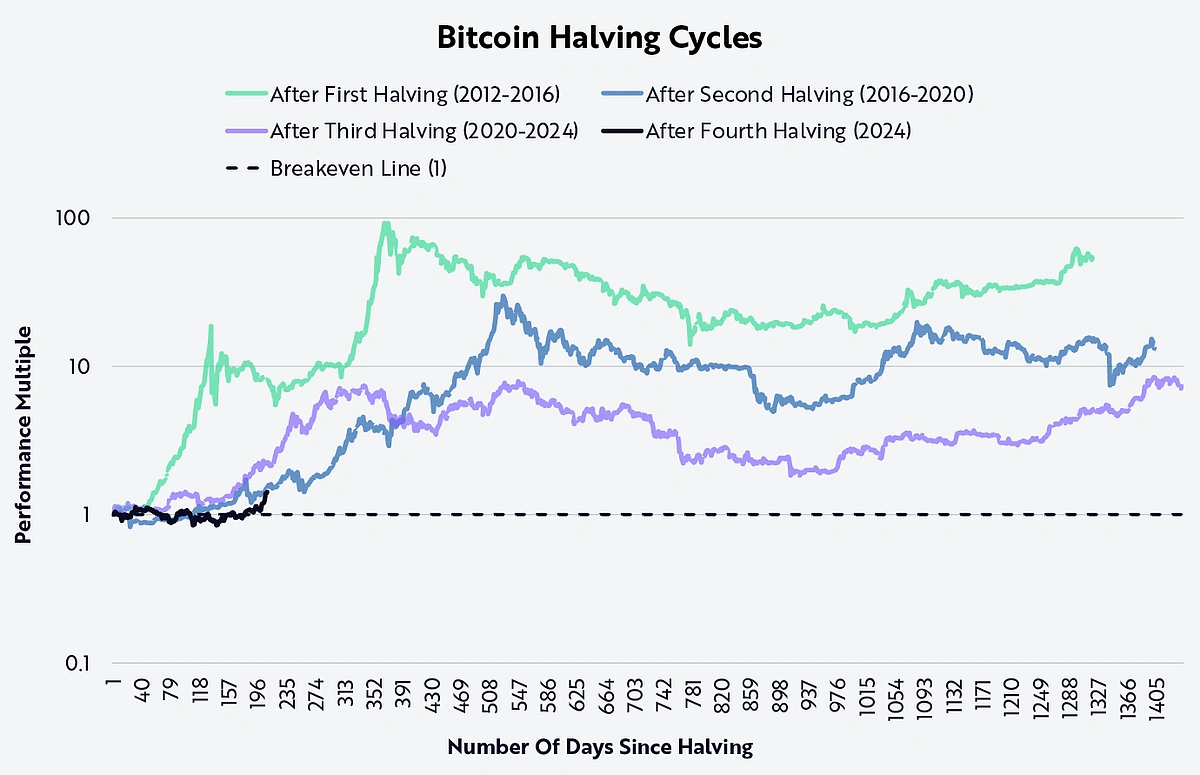
Historical Cycle Pattern
Every ~210,000 blocks, supply is cut, and historically, the biggest rallies have followed in the next year or so. The four halving dates are:
-
November 2012
-
July 2016
-
May 2020
-
April 2024
In prior cycles, peaks arrived 12-18 months after the halving, for example, 525 days after the 2016 halving in December 2017, and again in November 2021 after the 2020 halving.
The April 2024 halving points you toward late 2025 as the statistically likely window. Bitfinex’s cycle work puts a probable peak around Q3 to Q4 2025, roughly 450 days after the halving. Veteran trader Peter Brandt has a similar window and a target of about $200,000, originally predicting a tradable top in August or September 2025.
According to how I view the cycles in Bitcoin (low to high with halving marking the mid point (+/- one to two weeks) a tradable top could occur within the next six or so weeks https://t.co/uFjGCgduP1
— Peter Brandt (@PeterLBrandt) August 8, 2025
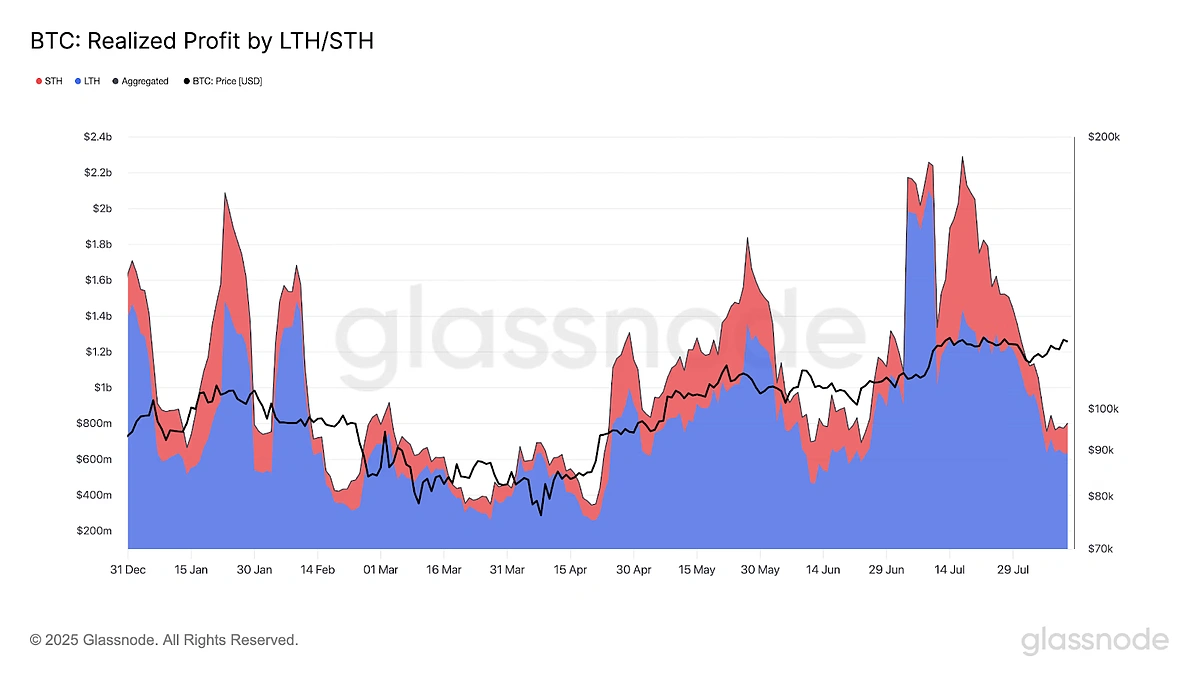
As of mid-August 2025 (at the time of writing), Bitcoin has set fresh records near 124,000 and is oscillating around 111,000 after pullbacks on macroeconomic developments. Glassnode shows long-term holders driving most realized profits while overall selling remains subdued, a setup that leaves room for higher highs if demand persists.
However, ARK Invest suggests the current cycle may diverge from historic performance because the 2022 drawdown was smaller than prior cycles, and early post-halving performance initially lagged past playbooks. This is likely because of a shifting structure as ETFs, corporates, and policy set the narrative for BTC demand as opposed to pure web3 forces like in the past.
Quantitative Models and Frameworks
Every experienced Bitcoin trader and analyst has their own go-to model for making sense of the BTC price chart and understanding where it’s headed next. While these models and frameworks are not definitive, they can certainly help anchor expectations, spot when narratives deviate, and make sense of Bitcoin’s chaotic price action.
Three of the most referenced approaches are.
-
Stock-to-Flow (S2F) model explanation
-
Cycle-based predictions methodology
-
Technical indicator insights
Stock-to-Flow (S2F) Uses Scarcity as a Signal
The S2F (Stock-to-Flow) model was popularized by PlanB (for Bitcoin). Its premise is that Bitcoin’s supply issuance halves roughly every four years, and this engineered scarcity should correlate with higher prices over time.
Essentially, S2F measures how scarce an asset is by dividing its stock (total supply) by its flow (annual new supply).
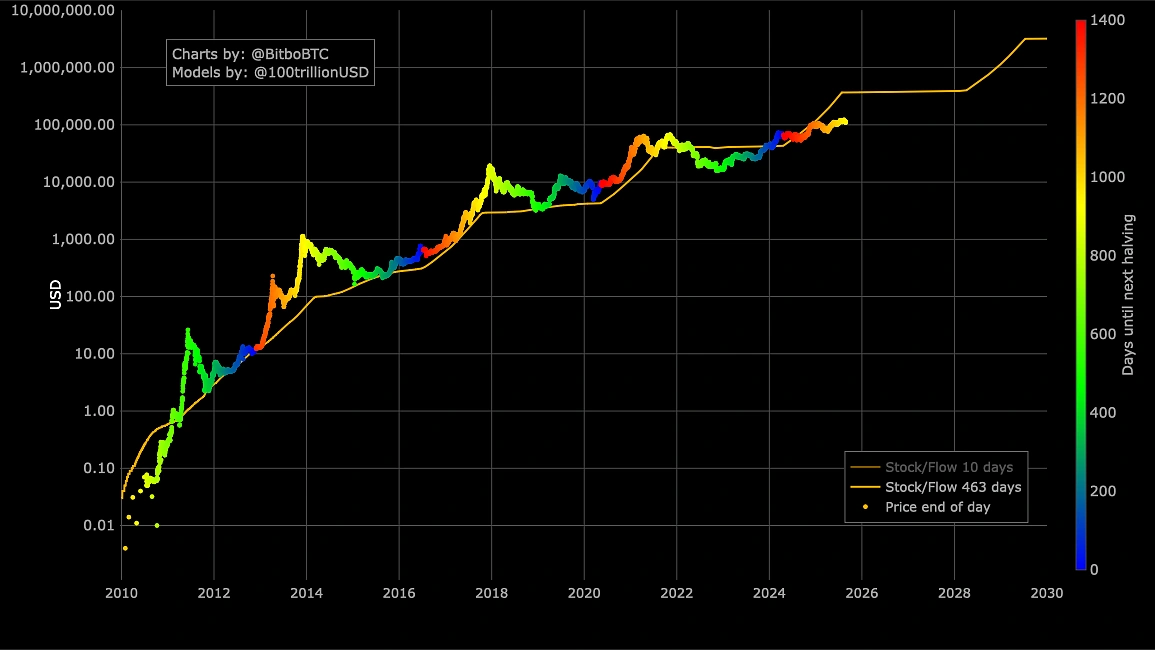
Source: BitBo
In traditional commodities like gold or silver, a higher stock-to-flow ratio (the total circulating supply relative to annual production) corresponds to greater value retention. Bitcoin, being digitally scarce, fits neatly into this narrative.
Historically, Bitcoin has indeed respected the S2F band during major bull cycles. Post-halving runs in 2013, 2017, and 2021 all showed parabolic rallies consistent with the scarcity thesis.
S2F’s critics argue the model oversimplifies demand dynamics in the short term. But as a long-range compass, S2F provides a clean framework, i.e., fewer coins coming to market tend to amplify demand shocks.
Cycle-Based Predictions Rely On History Repeating Itself
Historically, Bitcoin has followed a 4-year cycle tied to its halving events (roughly every 210,000 blocks). The typical phases are as follows:
-
Accumulation after the previous cycle
-
Breakout following the halving
-
Exponential rally
-
Blow-off top
-
Bear market
Past peaks occurred around 12–18 months post-halving. And based on the April 2024 halving, many expect 2025 to be the climax of the cycle.
But there’s a catch. Each cycle has diminishing returns. 2013 delivered 50x gains, 2017 closer to 20x, and 2021 around 7x. If the pattern continues, we may be looking at smaller percentage gains, but still a bullish path overall.
Technical Indicators Help with Short- and Mid-Term Price Navigation
Technical indicators are charting tools like moving averages, patterns, and signals that traders use to assess Bitcoin’s price momentum and trend strength. Below are a few examples of how technical indicators provide insight into what’s happening with Bitcoin’s price:
-
Death Cross: When the 50-day moving average crosses below the 200-day, often interpreted as a bearish signal.
-
Relative Strength Index (RSI): Overbought/oversold signals often mark major cycle tops and bottoms. The 2017 and 2021 peaks both coincided with extreme RSI values above 90 on weekly timeframes.
-
200-week moving average (WMA): Bitcoin has never closed a cycle below its 200WMA for long, making it a widely followed “floor” level.
How Professional Analysts Approach Bitcoin Predictions
The analysts featured in our predictions table—from JPMorgan to Standard Chartered to independent researchers—all use legitimate analytical frameworks, though they may reach different conclusions. Understanding how professionals combine different approaches can help evaluate their credibility.
Methodological Approaches Used by Featured Analysts
Institutional Research Houses (JPMorgan, Standard Chartered, Bernstein) typically combine:
-
Fundamental analysis of adoption trends and regulatory developments
-
Quantitative models comparing Bitcoin to other asset classes (like the gold market cap)
-
Macroeconomic analysis of monetary policy and institutional flows.
Independent Technical Analysts (Peter Brandt) primarily focus on:
-
Chart pattern analysis and long-term trend channels
-
Historical cycle timing and pattern recognition
-
Technical breakout levels and resistance zones.
Investment Strategists (Tom Lee at Fundstrat) blend:
-
Cycle analysis with macroeconomic factors
-
Institutional adoption trends and ETF flow analysis
-
Technical levels for timing and validation.
The Value of Multi-Model Analysis
The real edge comes from combining multiple analytical frameworks rather than relying on any single approach. Each model offers unique insights but also has limitations, so experienced analysts typically use several methods to cross-validate their predictions.
|
Model/Framework |
Core Concept |
Strengths |
Limitations |
Best Used For |
|
Stock-to-Flow (S2F) |
Scarcity-driven valuation based on supply reduction |
Clear mathematical framework, historically accurate during bull runs until 2021 |
Doesn’t account for demand shifts or external shocks |
Long-term trend direction, post-halving cycles |
|
Cycle-Based Analysis |
4-year Bitcoin market rhythms tied to halving events |
Consistent historical patterns, helps time market phases |
Assumes past patterns will repeat, diminishing returns over time |
Identifying potential peak and trough periods |
|
Technical Indicators |
Momentum and trend signals (RSI, moving averages, support/resistance) |
Real-time market sentiment, useful for entry/exit timing |
Can give false signals, works better in trending markets |
Short to medium-term price movements and timing |
|
On-Chain Metrics |
Network activity, wallet behavior, exchange flows |
Real-time fundamental data, shows actual usage patterns |
Complex to interpret, can lag price movements |
Validating underlying network health and adoption |
|
Regulatory developments, institutional adoption, macroeconomic factors |
Captures long-term value drivers, explains “why” behind moves |
Slow to reflect in price, difficult to quantify impact |
Understanding structural market changes |
The most accurate predictions often come from analysts who can identify when multiple frameworks align. For example, when S2F models suggest upward pressure, on-chain metrics show accumulation, and technical analysis indicates a breakout, these confluences may mark significant price movements.
How to Evaluate Bitcoin Price Predictions
Every few weeks, a new headline screams, “Bitcoin to $500k!” or “Bitcoin is going to zero!” The noise is relentless. And even in this article, there are multiple forecasts, each one posing a different number, and many of them coming from billion-dollar corporations or investment professionals.
So, how can someone reading this from a phone on a breakfast table without a financial team make sense of the predictions and pick what to run with?
It is certainly a challenge. So, here are four helpful pointers for yours:
-
Look at analysts’ track records
-
Separate models from speculation
-
Understand and manage risk
-
Choose an approach (DCA or timing)
Understanding Analyst Track Records
The first filter is simple but often ignored: Who is making the call?
A forecast from an independent trader on X should not be weighed the same as one from a macro strategist at a global investment bank. But that doesn’t mean the bank is always right either. What matters is track record and adaptability.
-
Did the analyst navigate past cycles with humility, updating their models when reality diverged?
-
Or did they stick to one number until it broke?
-
Have they published transparent reasoning, or are they chasing attention with bold claims?
Take Standard Chartered’s Geoff Kendrick’s analysis, for instance. He apologized for this $120K-BTC prediction and soon amended it to a newer number with changing market conditions. This shows how even the most established analysts may miss the mark significantly and that credible ones readily acknowledge and adjust their forecasts based on changing market conditions.
So, prioritize analysts who demonstrate process and learning over time.
Distinguishing Analysis Types
Quantitative Models: Frameworks using mathematical inputs like Stock-to-Flow, cycle analysis, or on-chain metrics. These provide probabilistic ranges, not certainties.
Fundamental Analysis: Examination of adoption trends, regulatory developments, and macroeconomic factors. Useful for understanding long-term value drivers.
Technical Analysis: Chart-based analysis using patterns, indicators, and market behavior. Helpful for timing and trend identification.
Speculation: Predictions without disclosed methodology, based on “gut feeling” or attention-seeking. Avoid allocating capital around these.
Managing Risk Around Uncertainty
Even the best models can break because of a regulatory shock, macro liquidity squeeze, or black swan event. That’s why seasoned investors focus more on how they position themselves around different predictions (bullish and bearish).
Some basic strategies include:
-
Limiting allocation size so one bad call doesn’t ruin you.
-
Holding dry powder for unexpected volatility or opportunities.
-
Using protective stops or hedges if you’re trading actively.
Remember: While Bitcoin offers upside potential, it is still a volatile asset.
Investment Strategies: Dollar-Cost Averaging vs. Market Timing
There are two popular strategies when investing in Bitcoin:
-
Dollar-Cost Averaging (DCA): Buying small amounts regularly, regardless of price. This reduces the emotional stress of trying to “time the top or bottom.” Historically, DCA into Bitcoin has worked well for long-term holders.
-
Timing the Market: Attempting to buy dips and sell peaks based on cycle or technical signals. While it can increase gains if done right, it’s risky—even professionals get it wrong.
If you’re not one to look at charts for many hours a day or setting several alerts at different price ranges for Bitcoin, then DCA is the way to go. With DCA, investors get to average out their buying price.
Risks and Considerations
2025 Bitcoin price predictions certainly seem very tempting to go all-in. Sure, not all price predictions are pointing to the same number, but they are all pointing in the same direction – up!
Hence, one could make a case that this is a good time to sell the house, put it on BTC, and exit in a few weeks with a good profit. Unfortunately, there are real risks that could derail even the most convincing models.
-
Market volatility: A call for $200k BTC is compelling, but it doesn’t prepare you for the reality that Bitcoin could plunge 30% on the way there.
-
Regulatory uncertainty factors: Policy shifts can accelerate adoption or freeze momentum overnight.
-
Potential “black swan” events: Bitcoin’s history is full of shocks no one saw coming – Mt. Gox collapsed in 2014, China banned BTC mining in 2021, and FTX failed in 2022. No model can account for these
-
Historical correction patterns post-cycle peaks: Historically, steep corrections are not the exception, but the expectation after a cycle peak.
-
2026 “crypto winter” possibilities: Each cycle has delivered a brutal cooling-off period 18–24 months after the halving-driven mania subsides. If you miss the timing to exit the market, your losses are likely locked in for years.
Conclusion
Bitcoin has repeatedly proven naysayers wrong over the past decade, rewarding believers. But it has also punished the over-leveraged investors and those who were too impatient to ride out a simple correction/pull-back.
Remember that volatility is the price of admission for Bitcoin’s upside potential. Manage it wisely, and the next few years could indeed be a defining period of growth for both Bitcoin and its investors.
Note that this entire article is purely for educational purposes. CoinGecko does not provide any financial advice nor solicits the buying of Bitcoin. Do your own research and invest at your own risk.